How LLMs Feed Your RE Habit: Following the Use-After-Free Trail in CLFS

TL;DR This post demonstrates how LLMs and pyghidra-mcp accelerate reverse engineering by tracing a use-after-free vulnerability in Windows’ Common Log File System (CLFS) through a patch diff, showing how AI maintains momentum in complex analysis. LLMs don’t replace the work—they feed the habit by making the work feel lighter, faster, and well… fun.
Reverse engineering has always been a mix of instinct, curiosity, and stubbornness. You follow threads, you chase weird behavior, you stare at code flows until they start to make sense. But something interesting happens when you add LLMs into the loop.
Not as oracles. Not as replacements. As momentum — the force that keeps you moving when the system gets complicated.
They help you move faster in systems you already know, and they help you build foundational structure in systems you’ve never touched. They can turn “Where do I start?” into “Show me the shape of this thing.”
How LLMs Feed Your RE Habit Series
This two‑part series covers both scenarios:
- First, tracing a UAF path in CLFS (a subsystem I know well enough to be dangerous)
- Then, mapping macOS XPC services (a subsystem I’m just learning)
Same tools, totally different terrain.
Let’s find out how LLMs feed your RE habit.
Understanding CLFS Context for CVE-2025-29824
Before diving into the vulnerability, let’s quickly understand what CLFS (Common Log File System) does in Windows. It’s the kernel-level logging system that provides high-performance, reliable, structured persistent logging for Windows components and applications.
CLFS is just another Windows kernel driver that quietly does its job… until it doesn’t. And when it doesn’t, the consequences surface directly in the kernel.
User-mode applications interact with it through Win32 APIs like CreateLogFile and ReserveAndAppendLog (from clfsw32.dll), which open special log handles by sending IOCTL requests straight to the clfs.sys driver in the kernel.
The vulnerabality can be triggered by creating a subtle race condition by sending these IOCTLs. Eventually, through the help of a patch diff, a blog post, and an LLM, we will see exactly how the vulnerability can be triggered.
Patch Diffing
Found the Bug, What Was the Bug Again?
Patch diffs are where the story starts, not where it ends.
When you’re patch diffing, finding the code changes is usually the easy part. The harder part (the part that actually matters) is understanding why the change was needed. That’s where the reverse engineering begins. You trace control flow, understand the code, and ask the classic question:
“Okay… but how does this actually become a bug?”
Give it a try. You can run the patch diff for CVE-2025-29824 yourself:
1
2
3
wget https://msdl.microsoft.com/download/symbols/Clfs.Sys/B199B0AF86000/Clfs.Sys -O clfs.sys.x64.10.0.26100.3624
wget https://msdl.microsoft.com/download/symbols/Clfs.Sys/931DCBBD86000/Clfs.Sys -O clfs.sys.x64.10.0.26100.3775
uvx ghidriff clfs.sys.x64.10.0.26100.3624 clfs.sys.x64.10.0.26100.3775
Check out the ghidriff result.
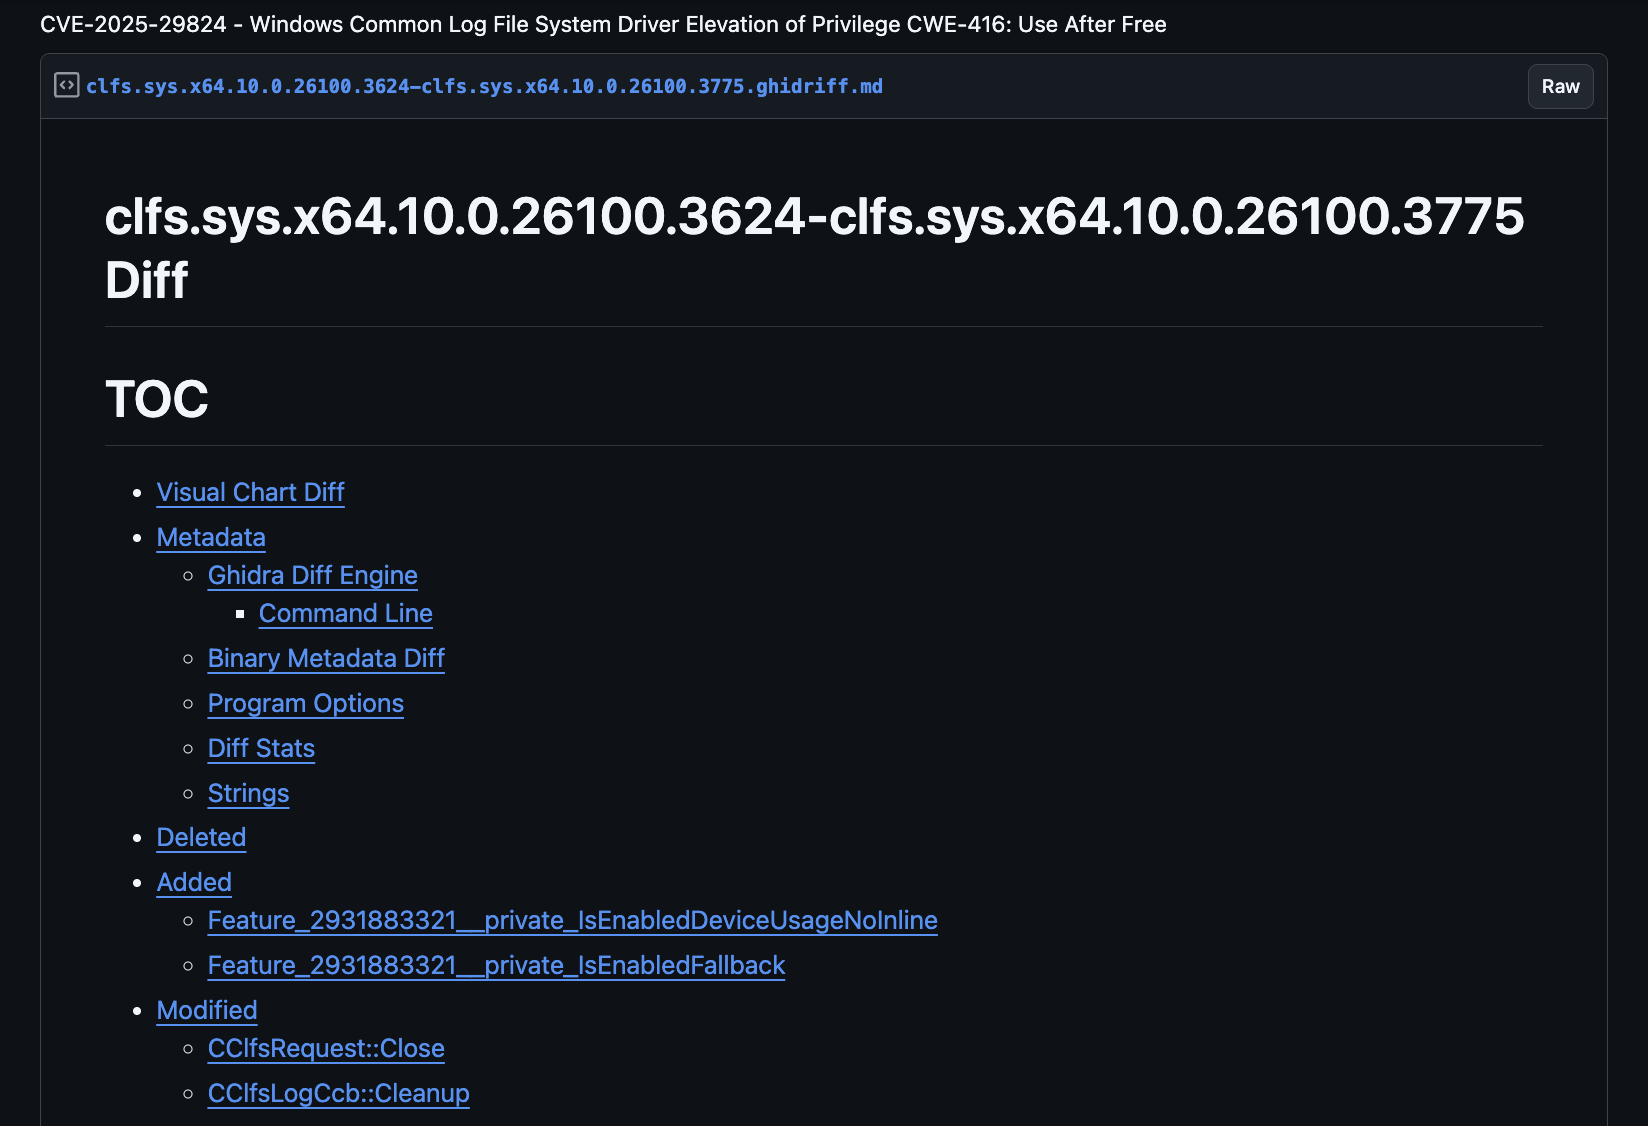 Ghidriff diff output showing CLFS patch changes
The diff shows modified functions, and we can examine exactly how the code changed. Since CVE-2025-29824 is a use-after-free (UAF), this gives us a head start and perfect context for an LLM.
Beyond the diff, sometimes you get lucky when someone’s already done the heavy lifting. Here we can use an excellent StarLabs write‑up on CVE‑2025‑29824. This detailed post gives the diff and vulnerability context, shape, and stakes.
Turns out, it’s a use-after-free vulnerability in the Windows Common Log File System (CLFS) driver. When a log file handle is closed, the FsContext2 structure is incorrectly freed in CClfsRequest::Cleanup(), while another IRP request can still be in progress. My Blind Date with CVE-2025-29824
When I read another write-up, I verify it myself. A good write‑up doesn’t replace your investigation; it gives you direction. You want to see the path, conditions, lifetime transitions, and the exact moment where CLFS lets a UAF slip through.
You can investigate this with Ghidra, Binja, or Ida, but what if you could automate some analysis with an LLM? Let’s try it.
Environment Setup and Tech Stack
To follow along, you’ll need a setup combining LLM knowledge with Ghidra’s analysis power. If you have hardware to run local LLMs, even better!
Local LLM Tech Stack
- Open WebUI and LM Studio: For running and chatting with local LLMs. Open WebUI provides a clean interface, while LM Studio handles model management and inference.
- Local LLMs for privacy (optional): For these demos I used nvidia/VIDIA-Nemotron-3-Nano-30B-A3B for secure, on-device processing. You can also configure Open WebUI to use an OpenAI compatible frontier model.
- pyghidra-mcp: Project-based, multi-binary analysis with dynamic importing. The latest release lets you import an entire directory, with all binaries auto-analyzed and ready for inspection. Additionally, callgraphs have been implemented so you can start to understand the control-flow path.
Troubleshooting Tips
If you’re hitting issues:
- pyghidra-mcp startup: Ensure
GHIDRA_INSTALL_DIRis set correctly - LLM context limits: Break complex analysis into smaller prompts.
- Binary import: CLFS analysis benefits from improved Ghidra GDTs. Check out some of my other posts to learn how to create those.
Starting With the Patch Diff
I started with the diff and context from the StarLabs blog. The change was simple on the surface with just a few lines modified in CLFS driver functions.
My first thought: “How well can an LLM match the analysis in the blog?”
First test. Using only the diff and a simple question…
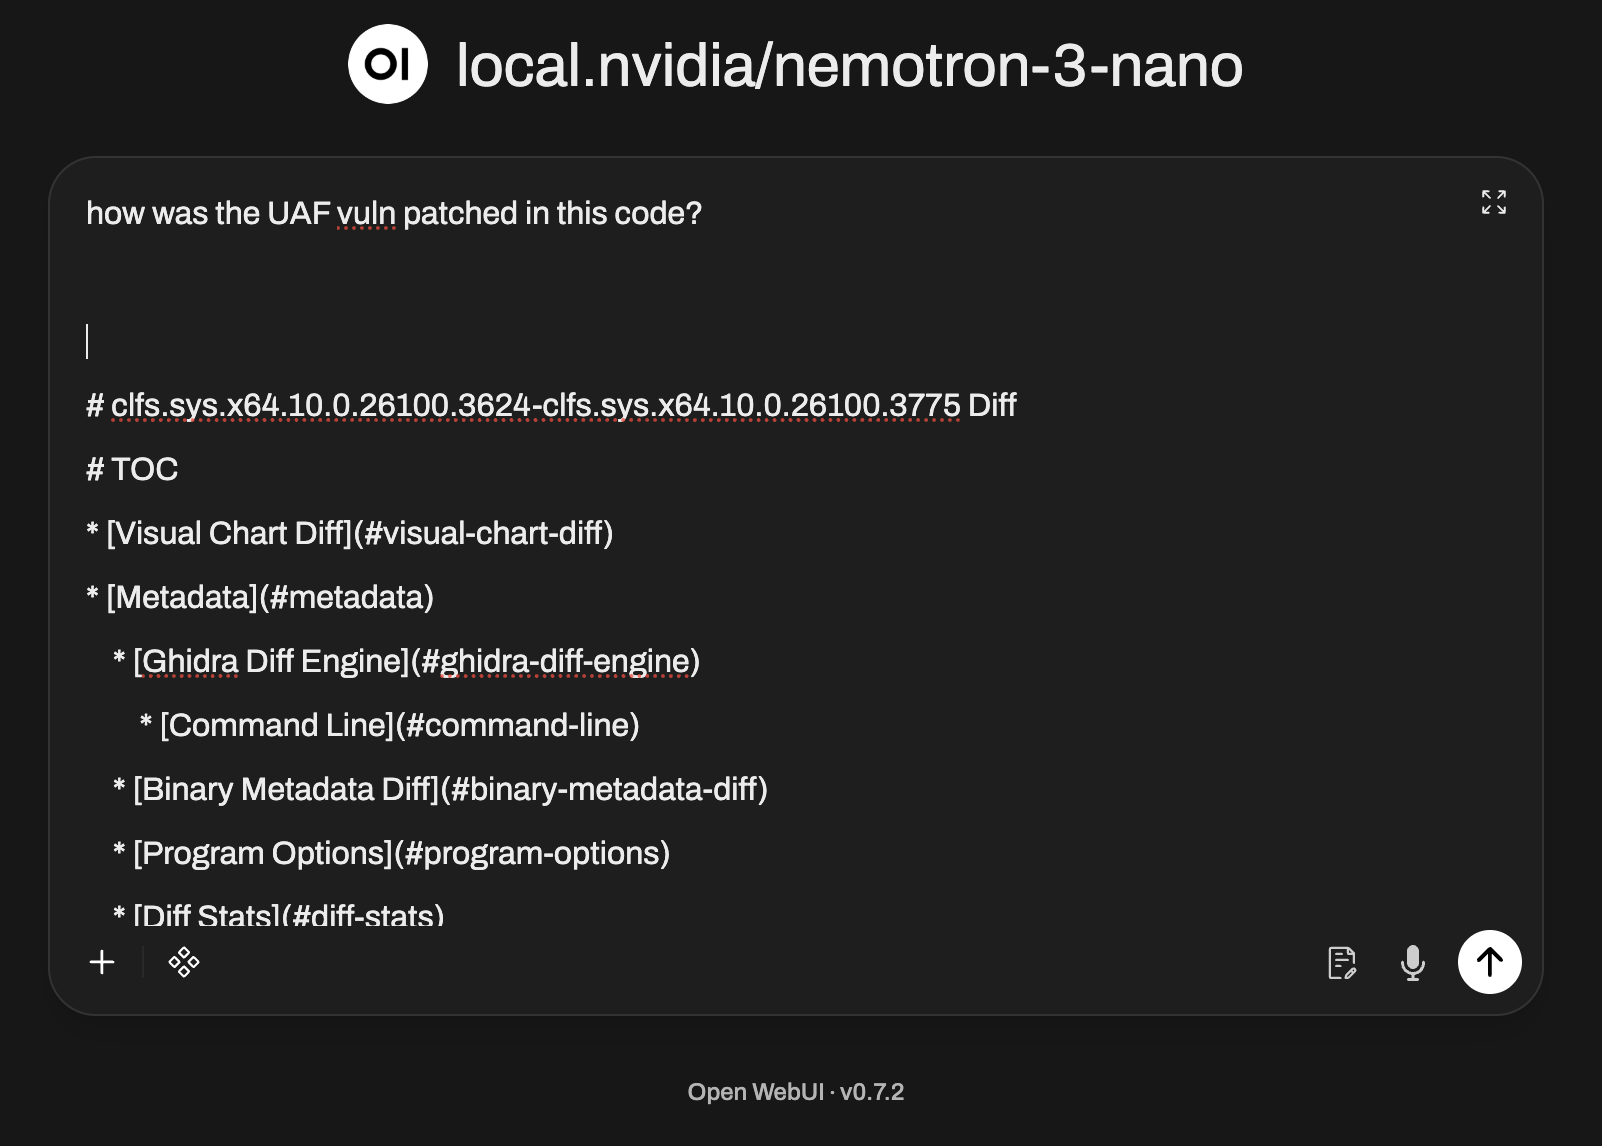 LLM prompt asking about CLFS patch changes
We get an accurate answer: 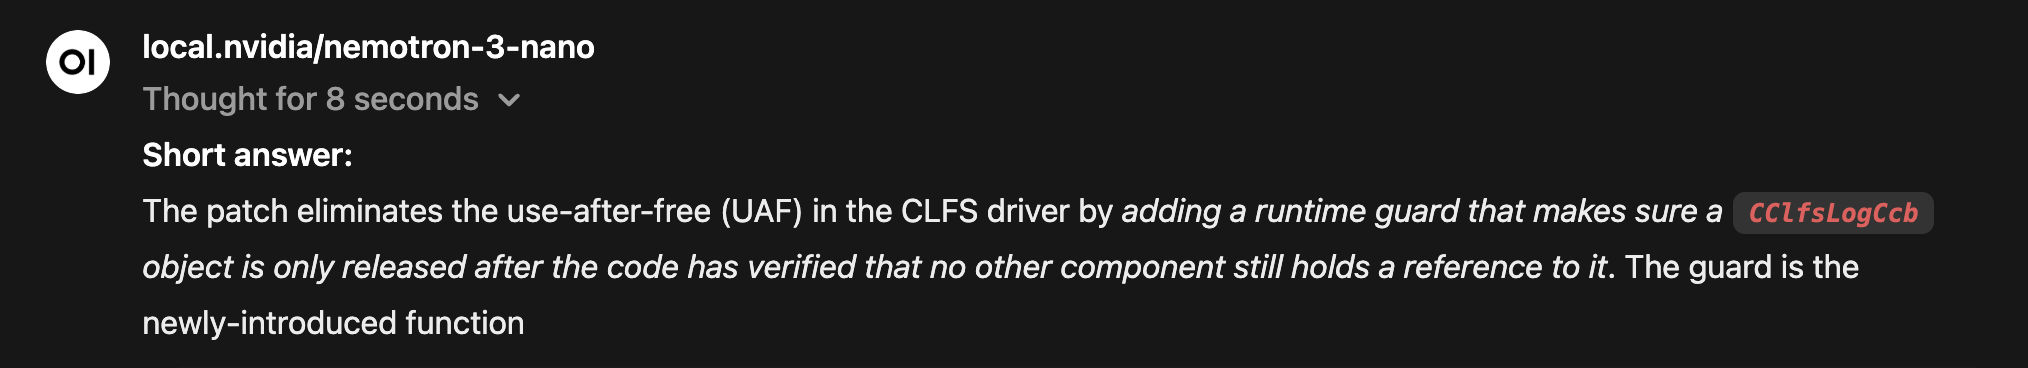 LLM response summarizing the security fix in CLFS
It even had the details about potential pending IRP requests that would cause the issue: 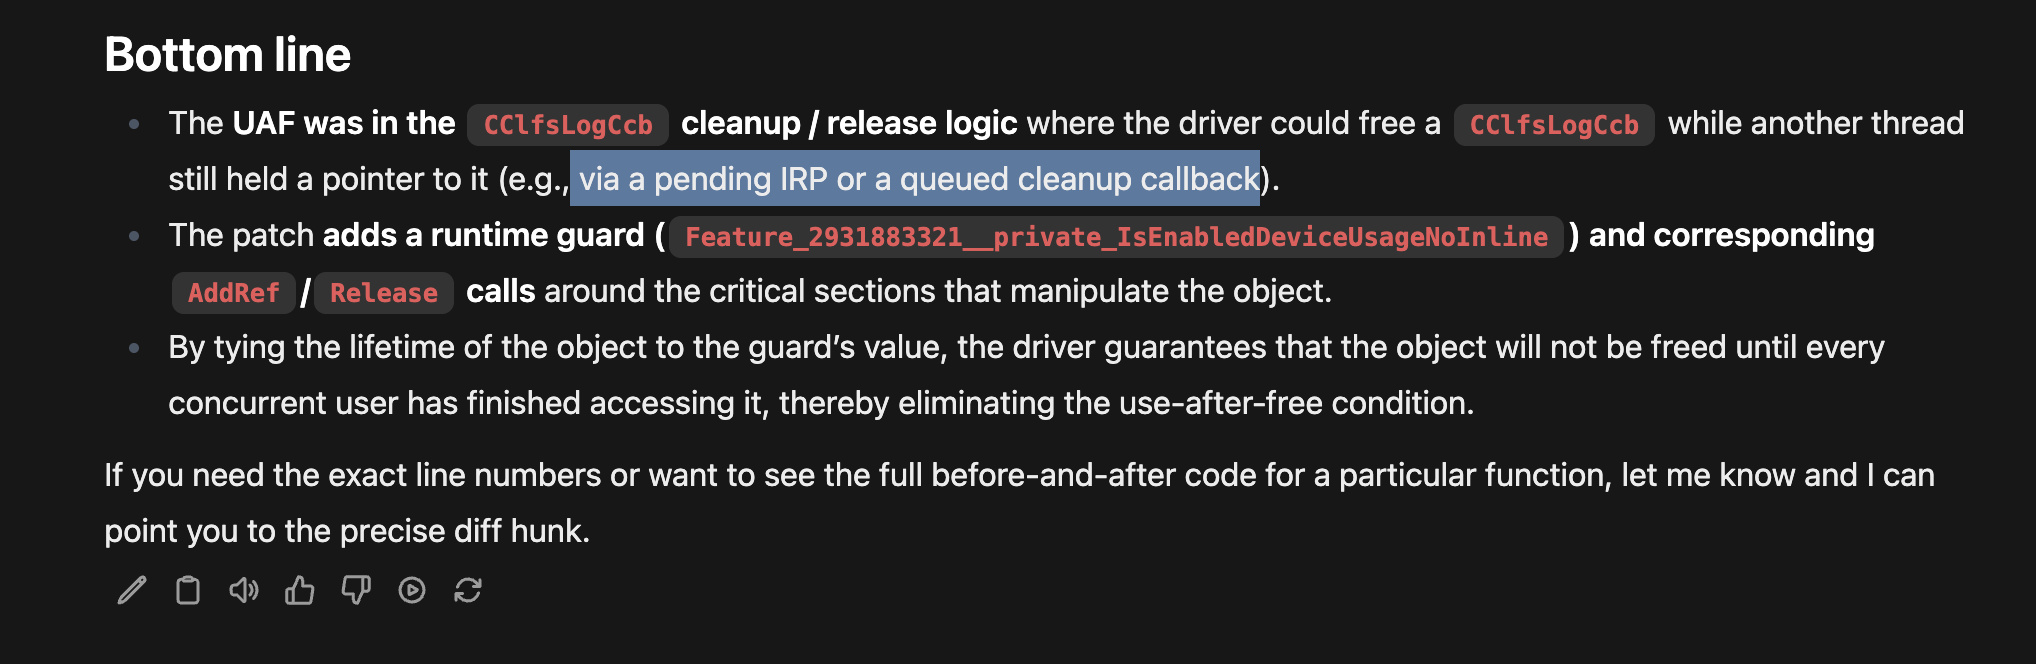 LLM details on potential pending IRP requests causing UAF
Remember this result came from a local LLM! 🤯
With just the patch diff and a targeted prompt, the LLM independently inferred the same race condition described in the StarLabs post. Not word‑for‑word, but still accurate.
That’s the momentum I’m talking about.
IRP Timing Deep Dive
The key insight for the vuln lies in understanding Windows I/O Request Packet (IRP) timing:
- IRP_MJ_CLEANUP: Sent when the last user-mode handle closes, but outstanding I/O requests might still be active
- IRP_MJ_CLOSE: Sent only when the last reference to the file object is released and all I/O is complete
Think of cleanup as the application saying “I’m done with this handle,” while CLOSE is the kernel saying “Everyone is done with this object.” The vulnerability lives in this timing window (between cleanup and close), the FsContext2 structure can be accessed by other threads after being freed.
You can learn these facts from the blog post, experience, or from the knowledge in a 30B 4-bit 18GB quantized model from Nvidia running on your local machine.
 30B 4-bit 18GB quantized model from Nvidia
Amazing.
Now that we understand the vulnerability, how could we dive deeper, either to see actual code from the binary or to verify the blog analysis?
What other questions might we come up with?
New question: “Where does the UAF path actually form?”
Let’s see for ourselves.
Importing the Vulnerable CLFS Binary
Using pyghidra-mcp, I imported the vulnerable version of the CLFS driver (clfs.sys). Auto-analysis completed quickly; everything was indexed and cross-referenced - ready for vibes.
Setup Verification
Normally you can just run pyghidra-mcp and have it run with the transport streamable-http.
1
2
# Verify pyghidra-mcp is running and can see the binaries
$ uvx pyghidra-mcp -t http --port 1337 /path/to/clfs_vulnerable.sys
To use it with Open WebUI, you need to wrap your MCP with mcpo and run it with stdio. See mcpo details here.
Something like this should work:
1
$ uvx mcpo --port 1337 -- pyghidra-mcp analyzed-clfs-bins/clfs.sys.x64.10.0.26100.3624-7fc7ad.gzf
The server should report the binary loaded successfully with analysis complete.
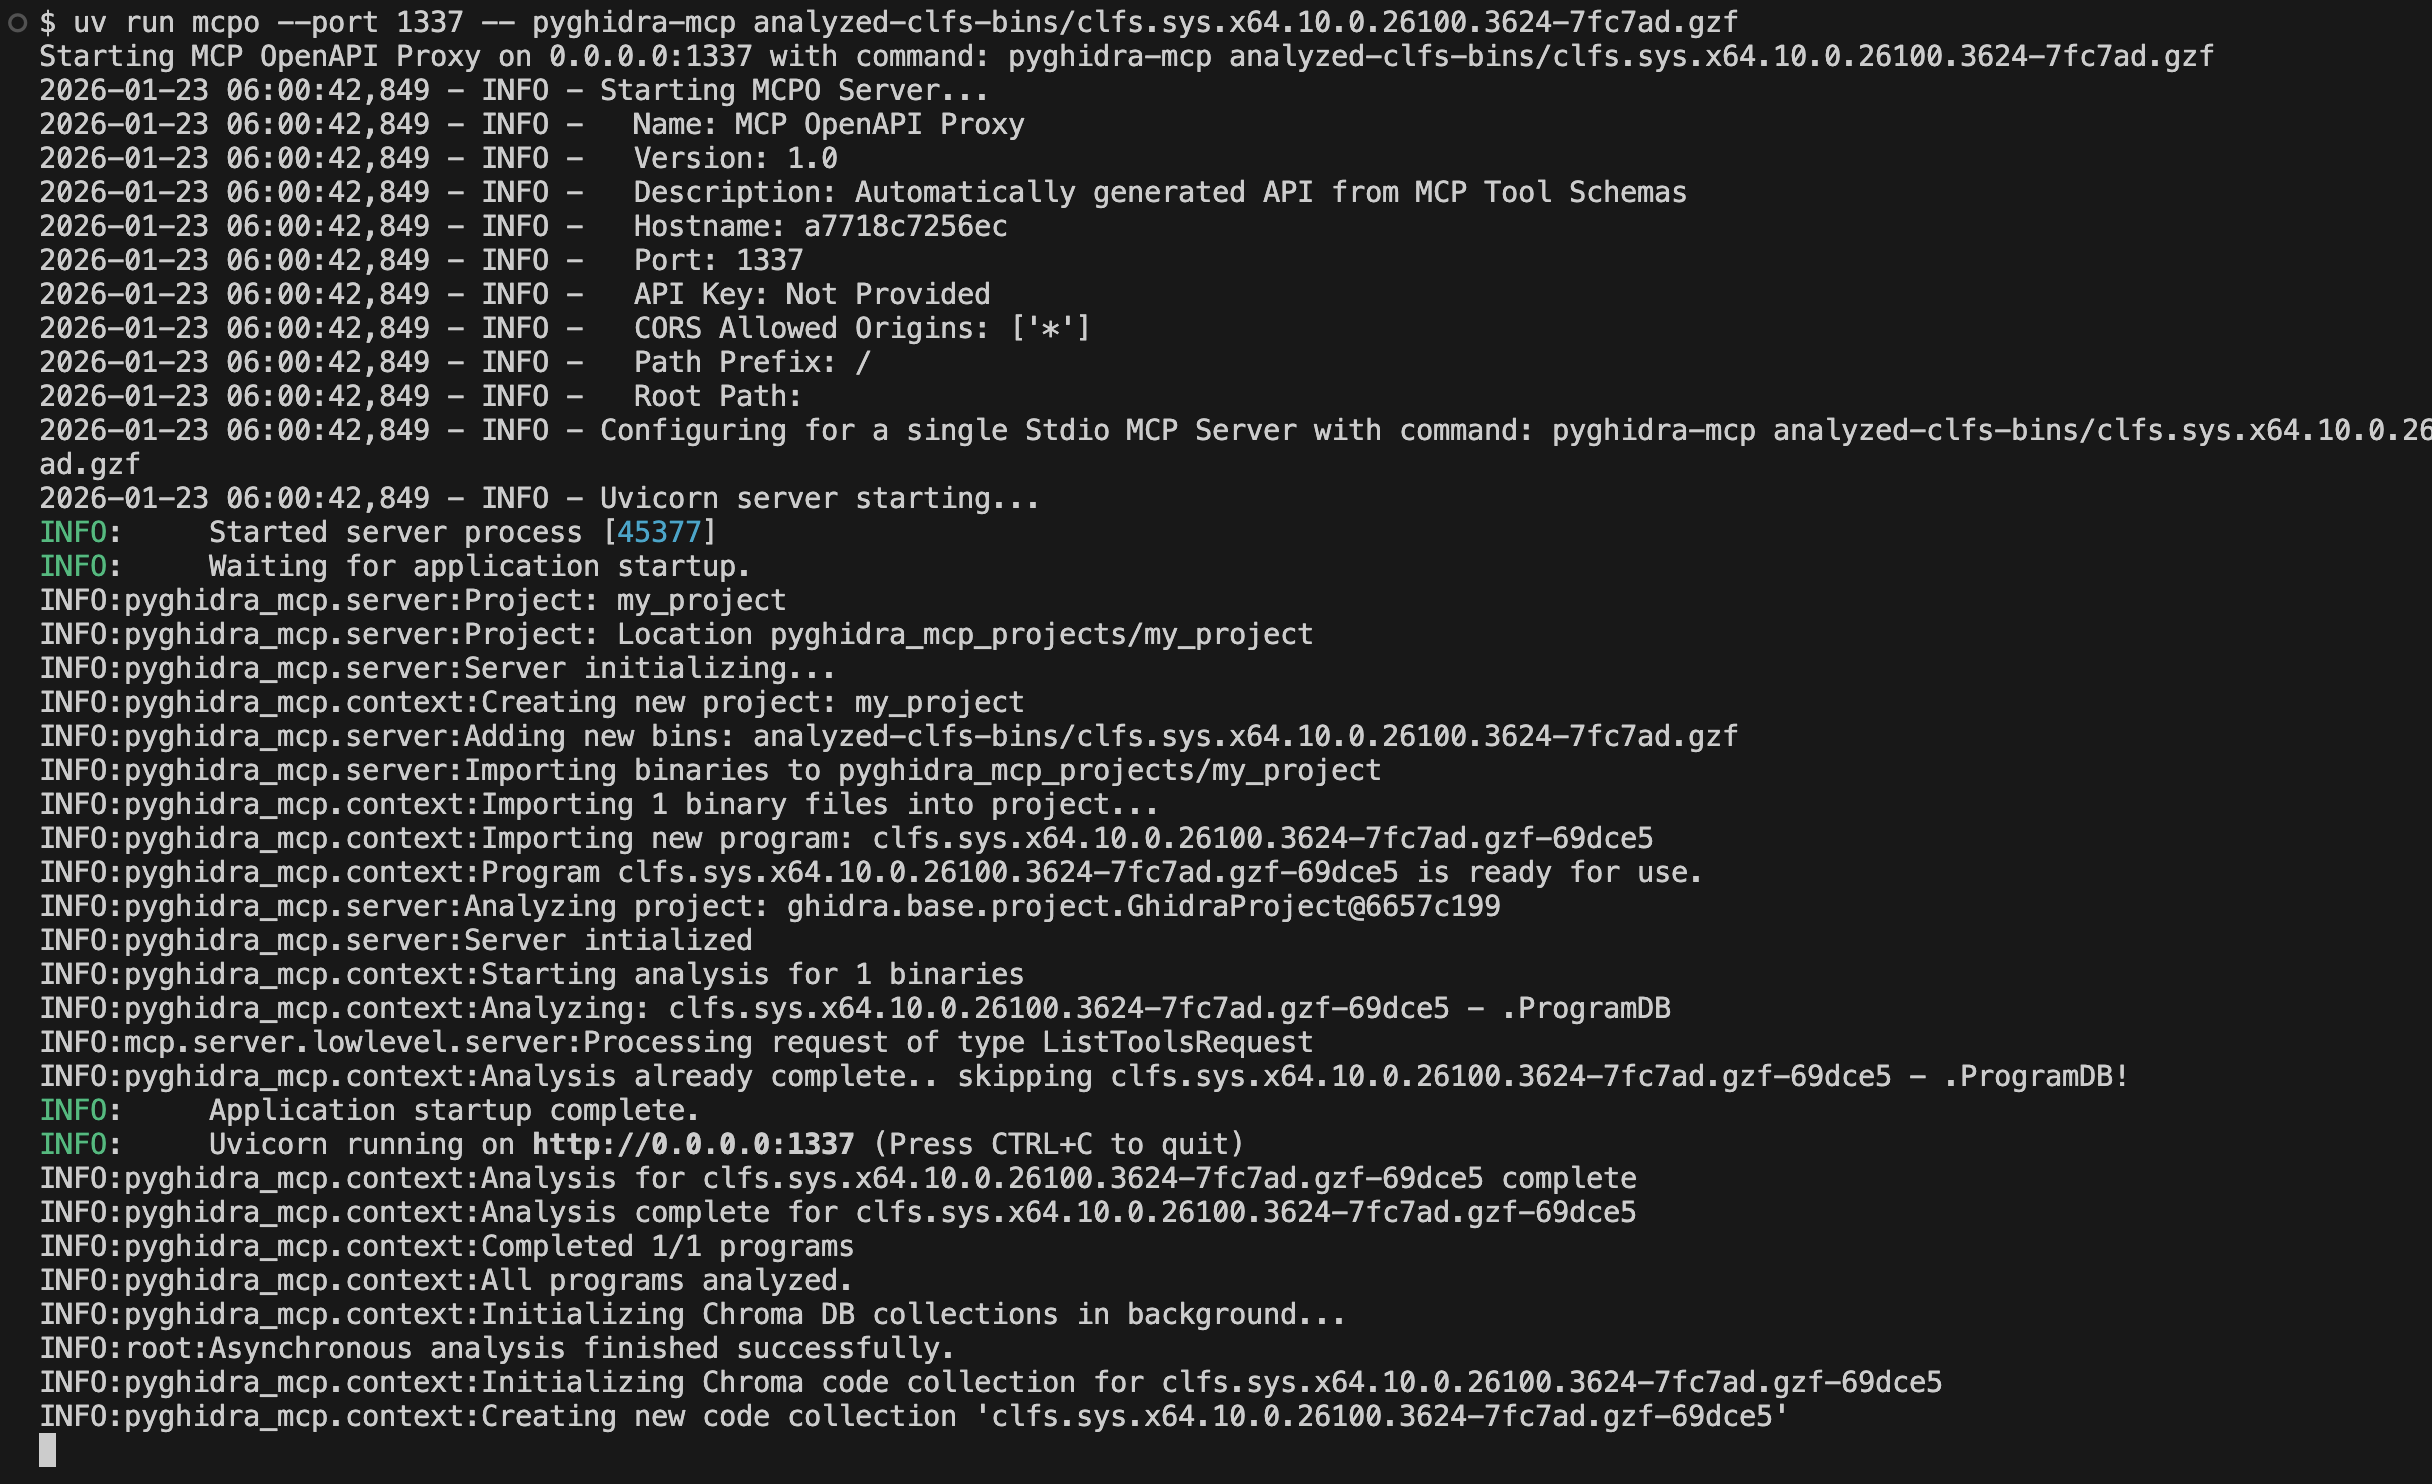 pyghidra-mcp server reporting CLFS binary loaded successfully
Once the mcp server is running on port 1337, wrapped nicely with mcpo, you can configure it in Open WebUI.
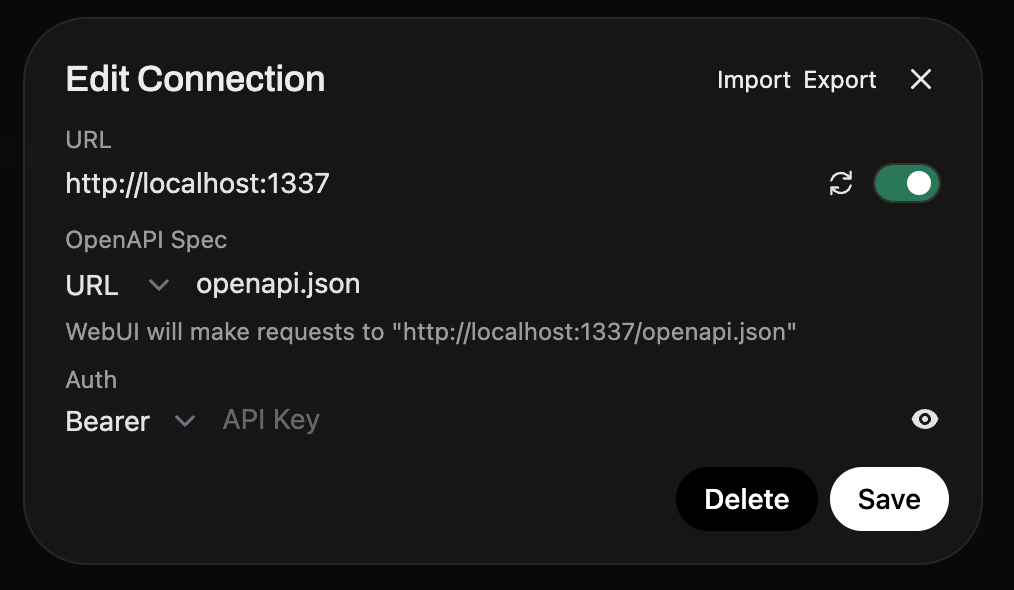 Open WebUI configuration for MCP server
Once there, it should be available in your chat window
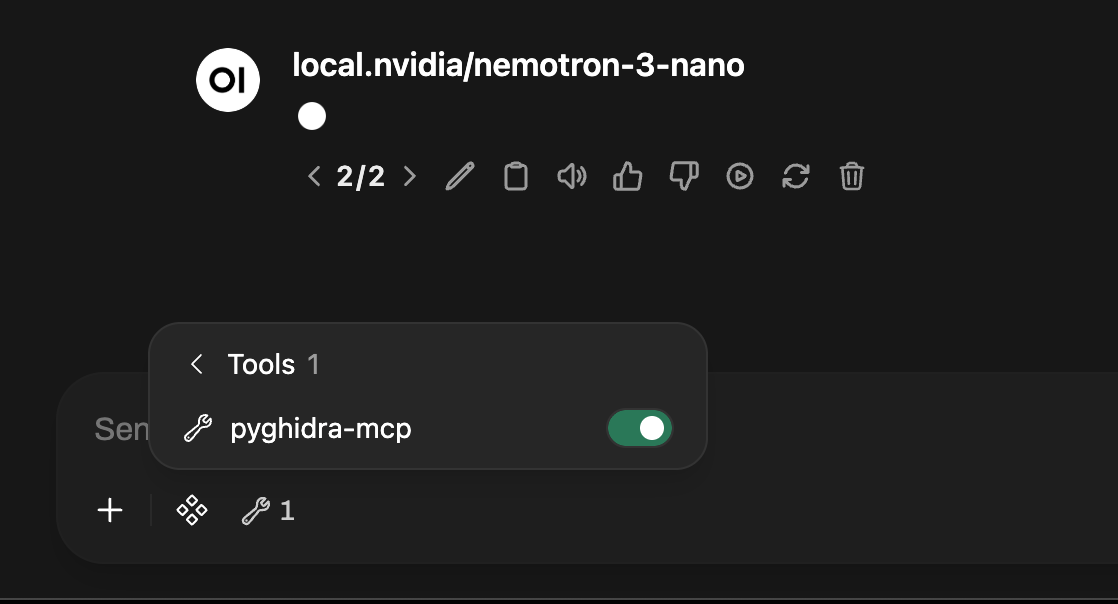 Open WebUI chat window with pyghidra-mcp tools available
The next time you ask a question, the pyghidra-mcp tools will be available. To discover more about the pyghidra-mcp tools and setup check out the previous post introducing pyghidra-mcp.
Tracing the UAF CLFS Code Flow
List project binaries to make sure it’s there and has been analyzed. 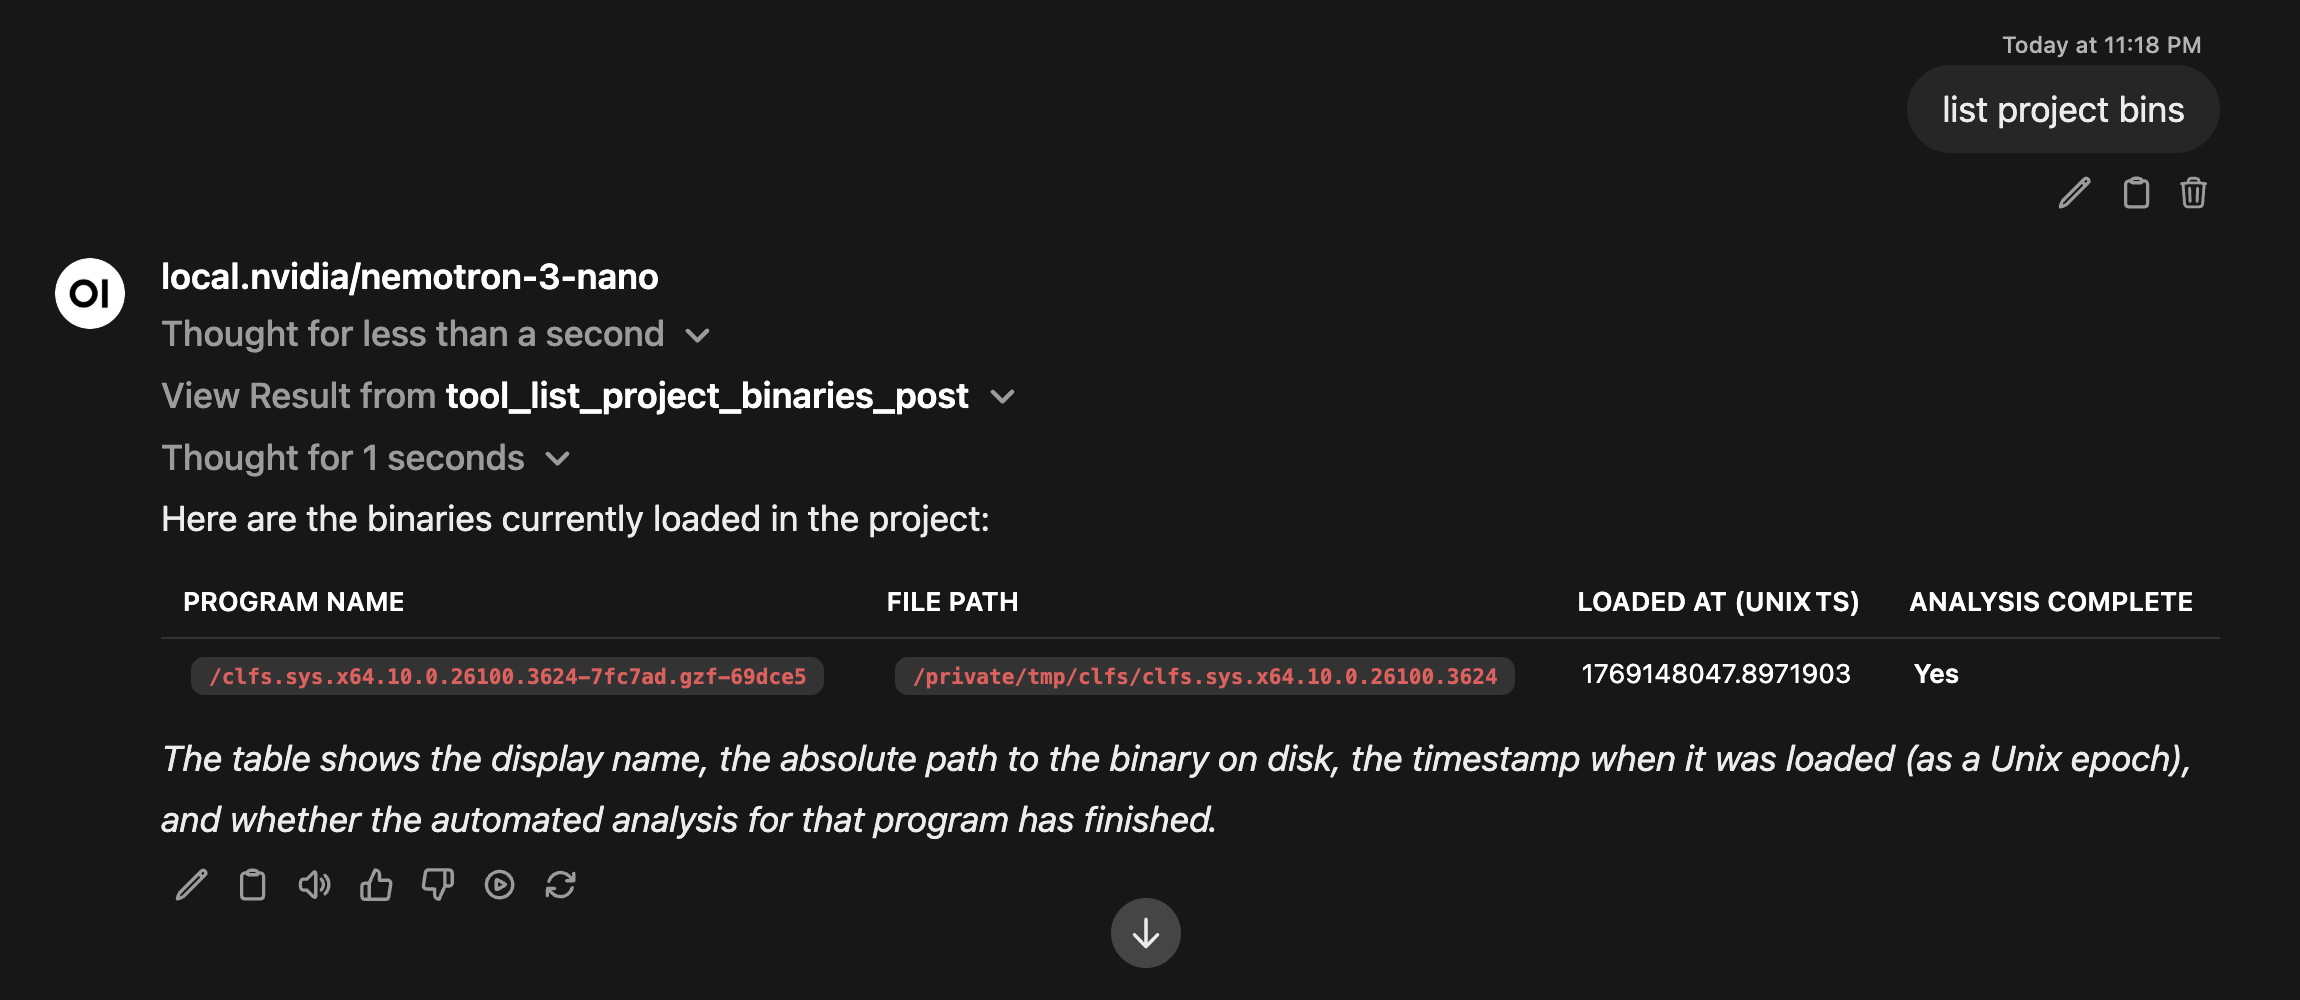 List of CLFS binaries loaded in pyghidra-mcp
Then I gave it some context from the blog and asked it to show me the vulnerable cleanup function..
“Verify the release occurs in the function CClfsLogCcb::Cleanup , show me the decompiled code, and the code path for an IRP request ending at the cleanup function.”
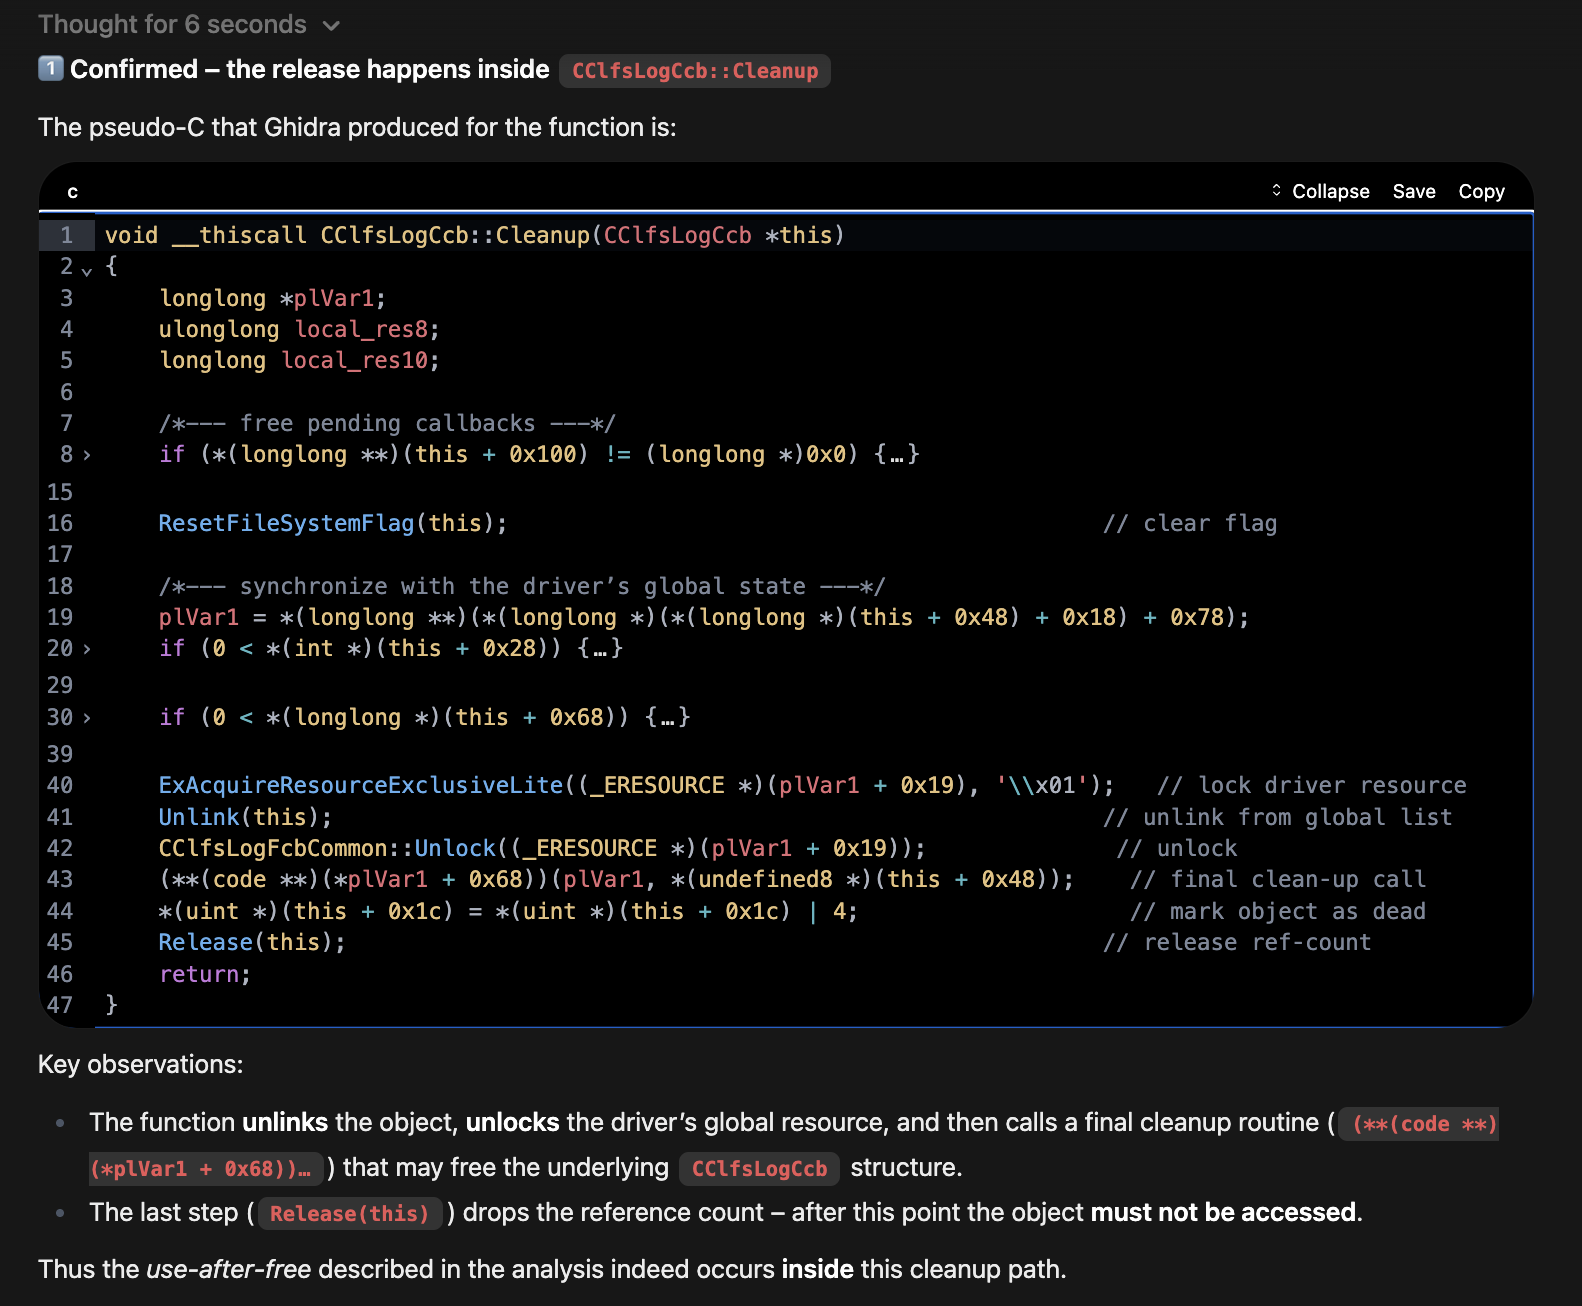 Decompiled CClfsLogCcb::Cleanup function showing release logic
Then it gave me the code path with a nice visual and summary. This would help someone trying to understand in general how drivers handle incoming I/O Request Packets (IRPs).
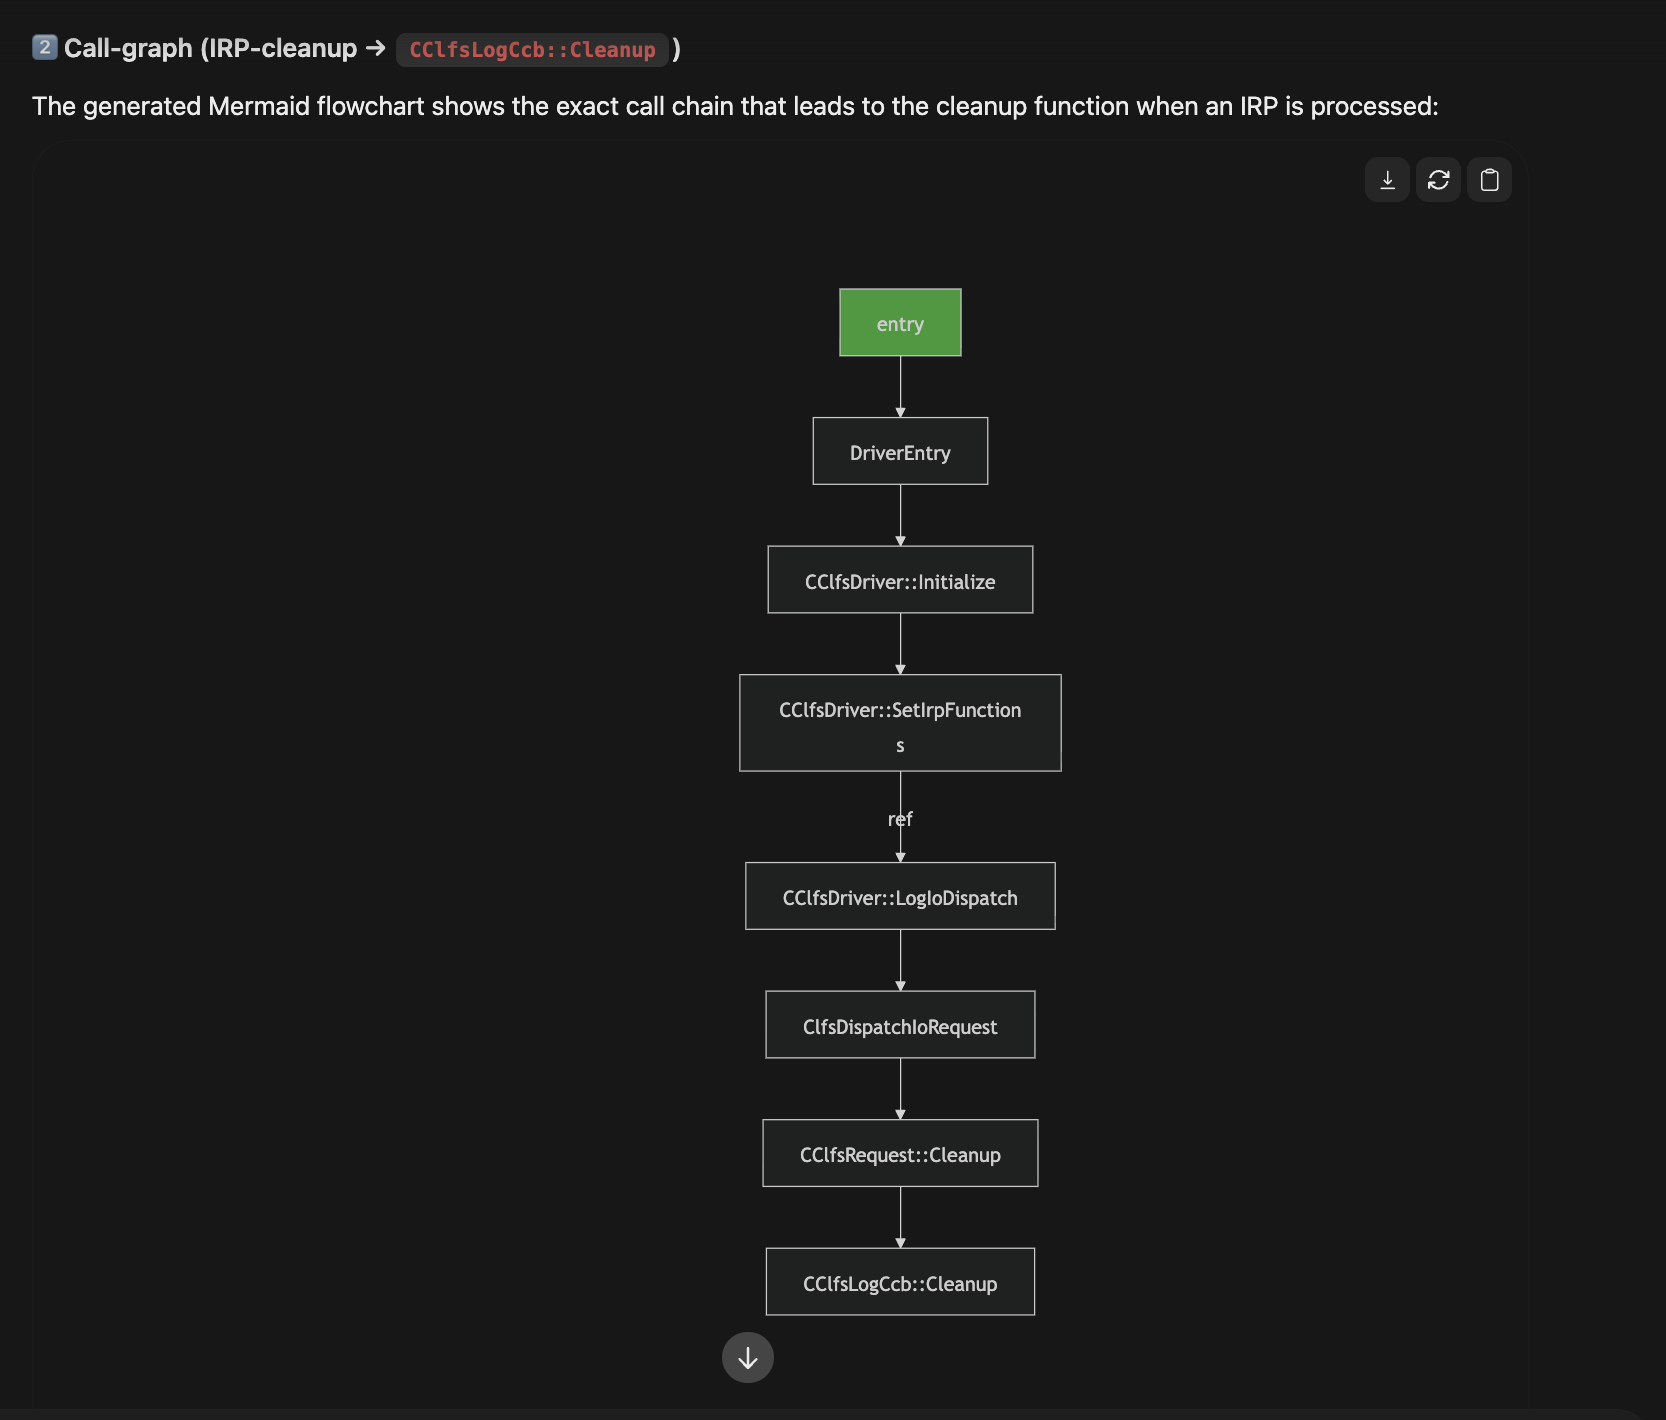 MermaidJs - Visual representation of IRP handling code path
Summary of code path: 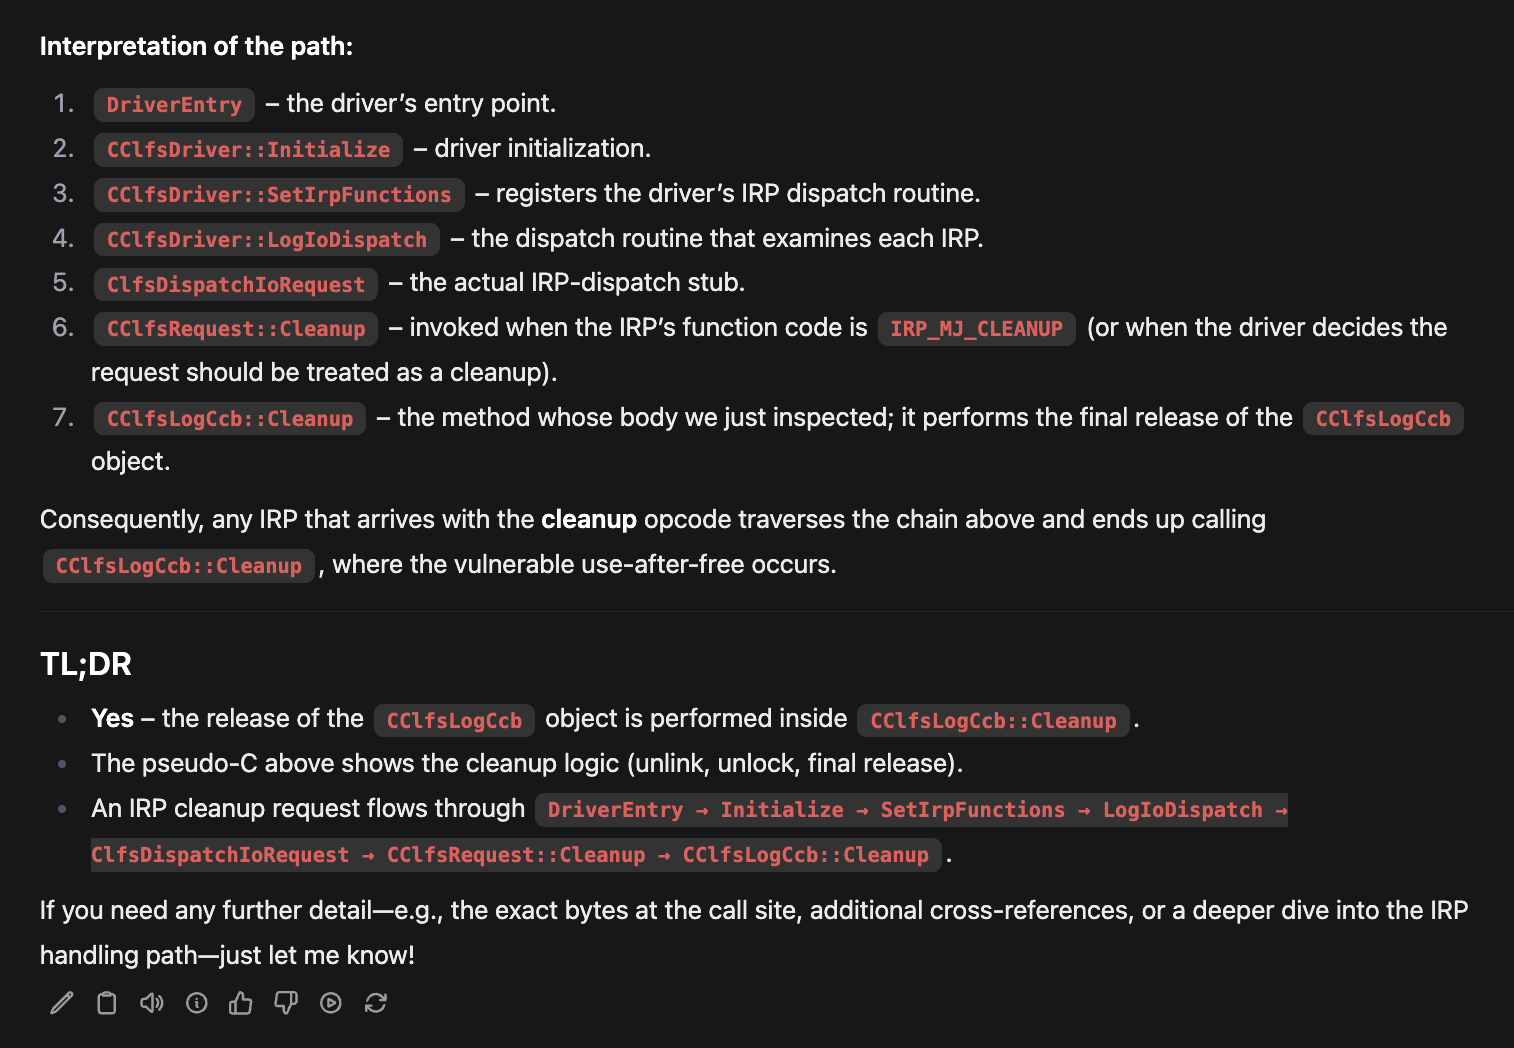 Summary of the IRP code path and cleanup interaction
The Actual Use After Free
The blog and patch diff taught us that this is the issue. A load and dereference of the FsContext2 object from two different IRP requests.
graph TD
    A[IRP_MJ_CLEANUP] --> B[CClfsRequest::Cleanup]
    B --> C[CClfsLogCcb::Cleanup]
    C --> D[CClfsLogCcb::Release]
    D --> E[FsContext2 Freed]

    F[IRP_MJ_DEVICE_IO_CONTROL] --> G[CClfsRequest::ReadArchiveMetadata]
    G --> H[Access FsContext2->m_Resource]

    style E fill:#8a1919
    style H fill:#8a1919
The red boxes show the race condition - FsContext2 can be freed in the cleanup path while still being accessed by the I/O path. These conditions can be setup by sending a DeviceIocontrol (IOCTL) with a specific IOCTL while at the same time calling CloseHandle on reference to the CLFS object.
How could we investigate this more?
Looking for Use
The StarLabs write‑up has a section titled “Finding the Right Functions”. At this point we can stop reading and start tracing. You don’t just want to believe the UAF path exists, you want to see it in the binary.
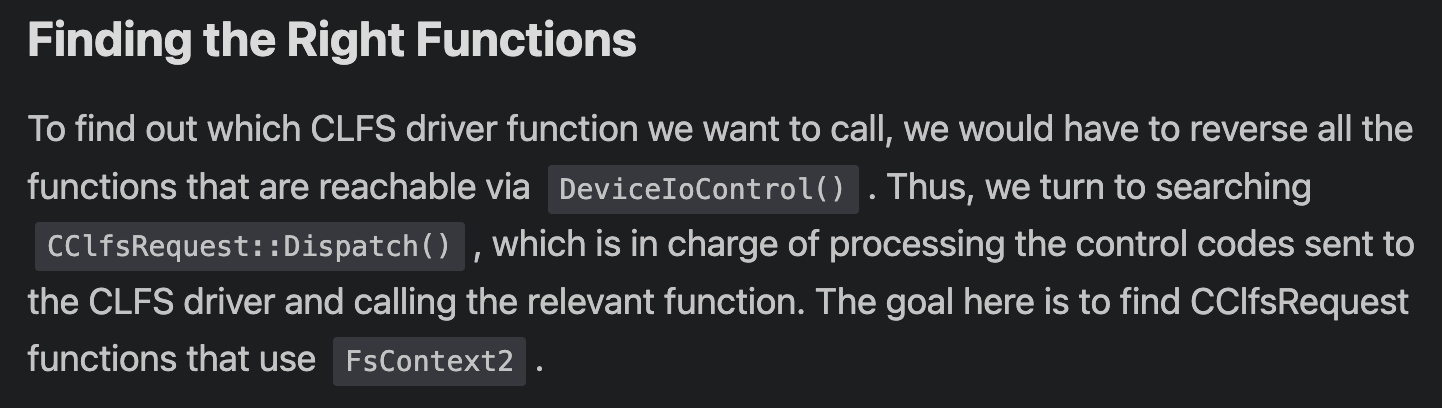 Finding the right functions for FsContext2 UAF analysis
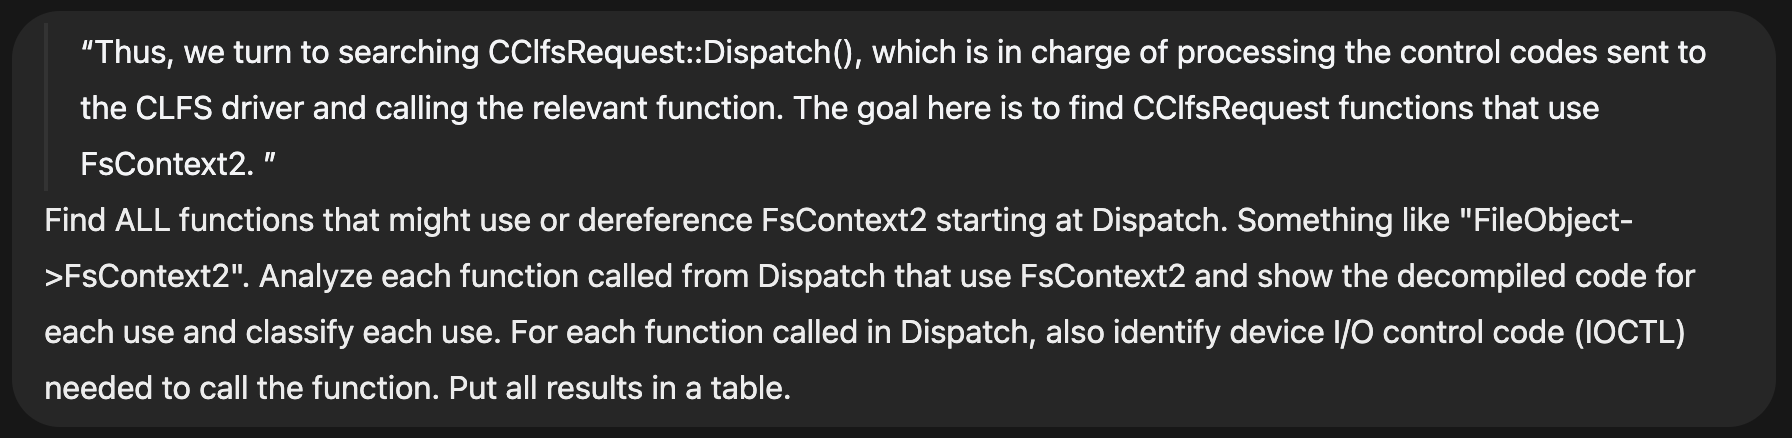
Can we automate that search? I asked the LLM:
“In what other functions is
FsContext2accessed that could cause the UAF? Look specifically forFileObject->FsContext2.”
 LLM search results for FsContext2 usage that could cause UAF
I also asked it to map out the IOCTL codes needed to actually trigger the various code paths.
Here LLMs move from convenience to assistant in your RE workflow. Instead of manually spelunking through CLFS, I can get help: list binaries, decompile functions, pull cross‑references, generate callgraphs. All this inside a conversational loop.
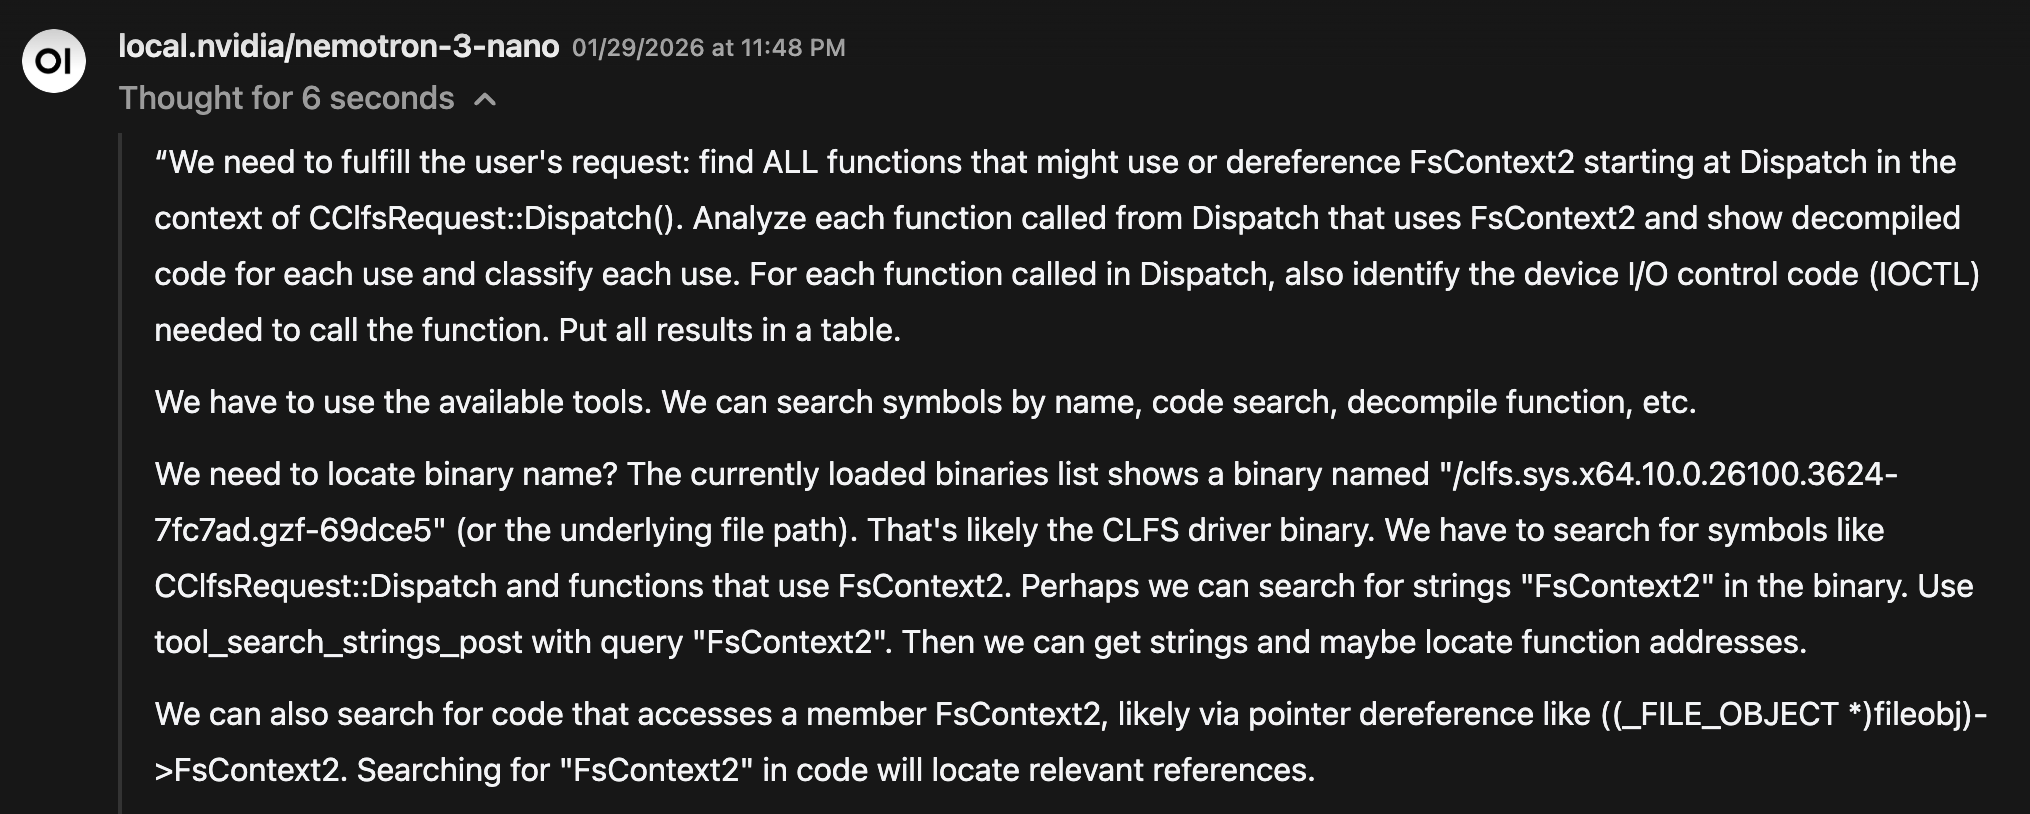 LLM starting to understand the task and reviewing available tools
The LLM starts making a plan, like a real analyst…
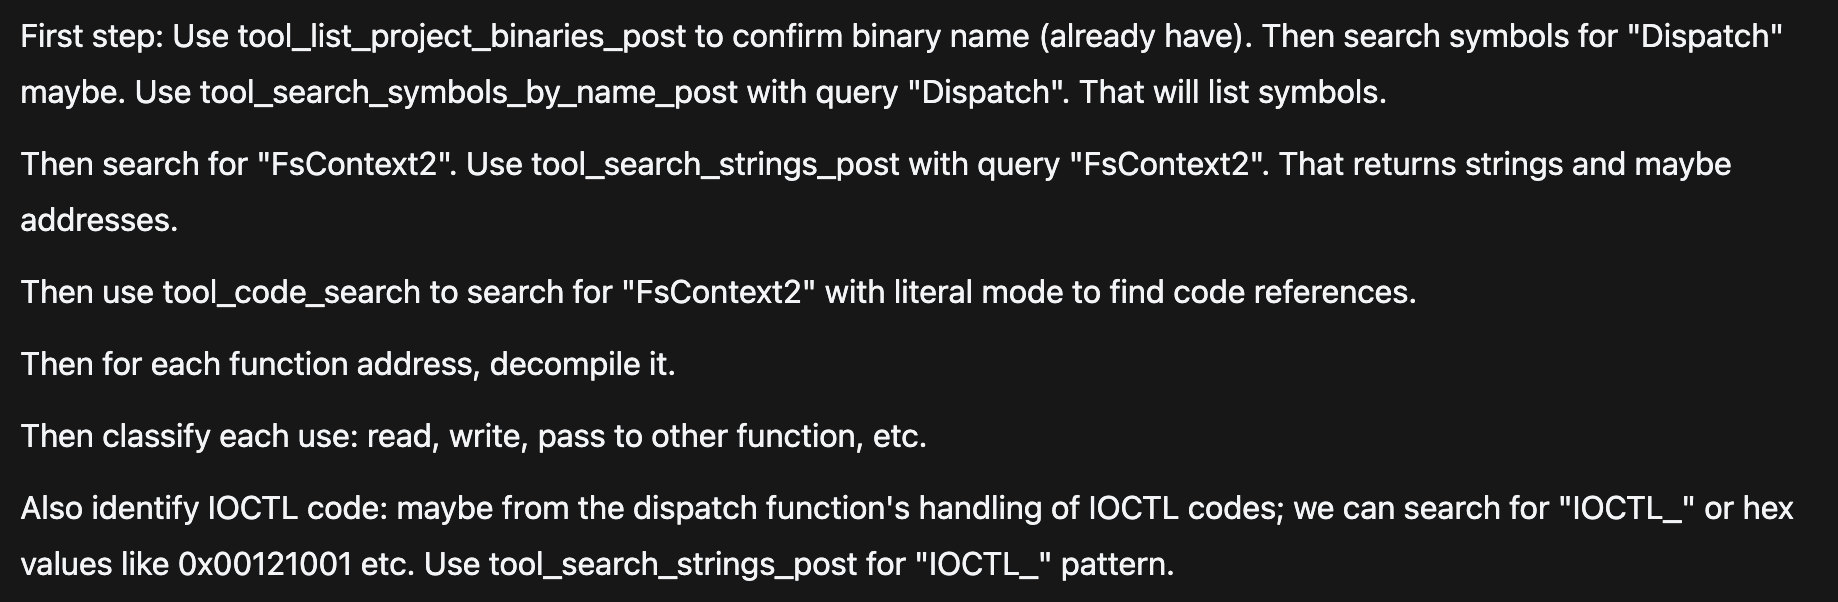 Thinking output: LLM creating analysis plan like a real analyst
The LLM Found the Same Vulnerable Functions StarLabs Identified + More
In the StarLabs analysis, once they determined the offset of FsContext2, they manually inspected each function that dereferenced it.
They ended up with three key functions:
CClfsRequest::ReserveAndAppendLog()CClfsRequest::WriteRestart()CClfsRequest::ReadArchiveMetadata()
These are the functions that dereference FsContext2 and can collide with the cleanup path, creating the UAF window.
When I asked the LLM to search for FsContext2 usage, it independently surfaced several of the same functions without being told they existed.
It did this by:
- scanning the CLFS binary
- identifying references to the
FsContext2offset - decompiling each candidate function
- verifying actual dereferences
- cross‑checking with IRP paths
By making several tool calls:
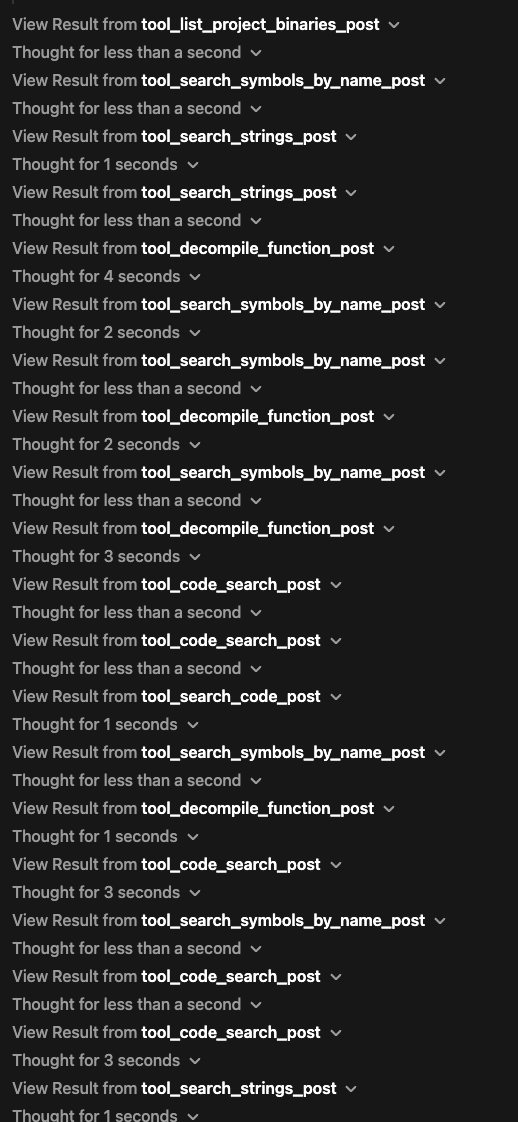 LLM making multiple tool calls for binary analysis
Exactly the same workflow StarLabs performed manually, but compressed into a few conversational prompts.
Starting at Dispatch:
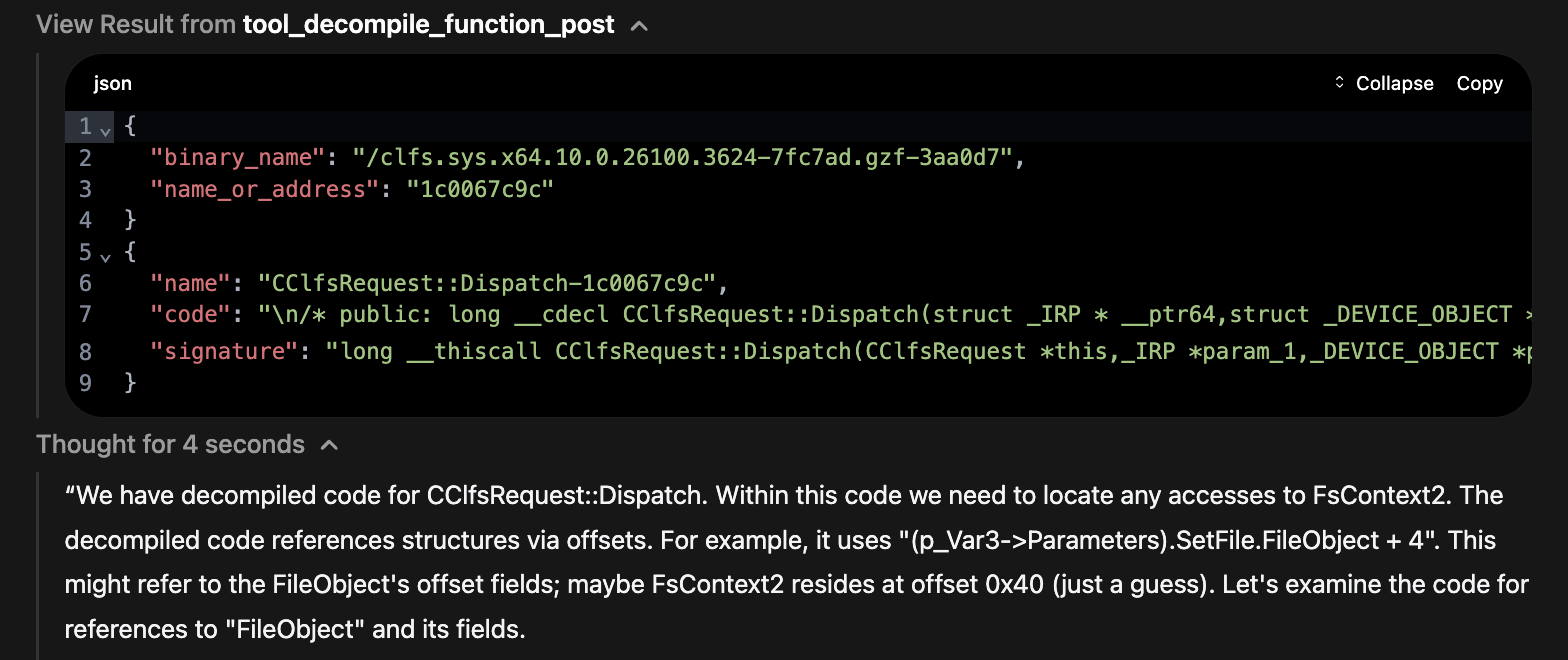 Starting analysis at the Dispatch function
It started to discover the functions that might cause use of FsContext2 like WriteRestart 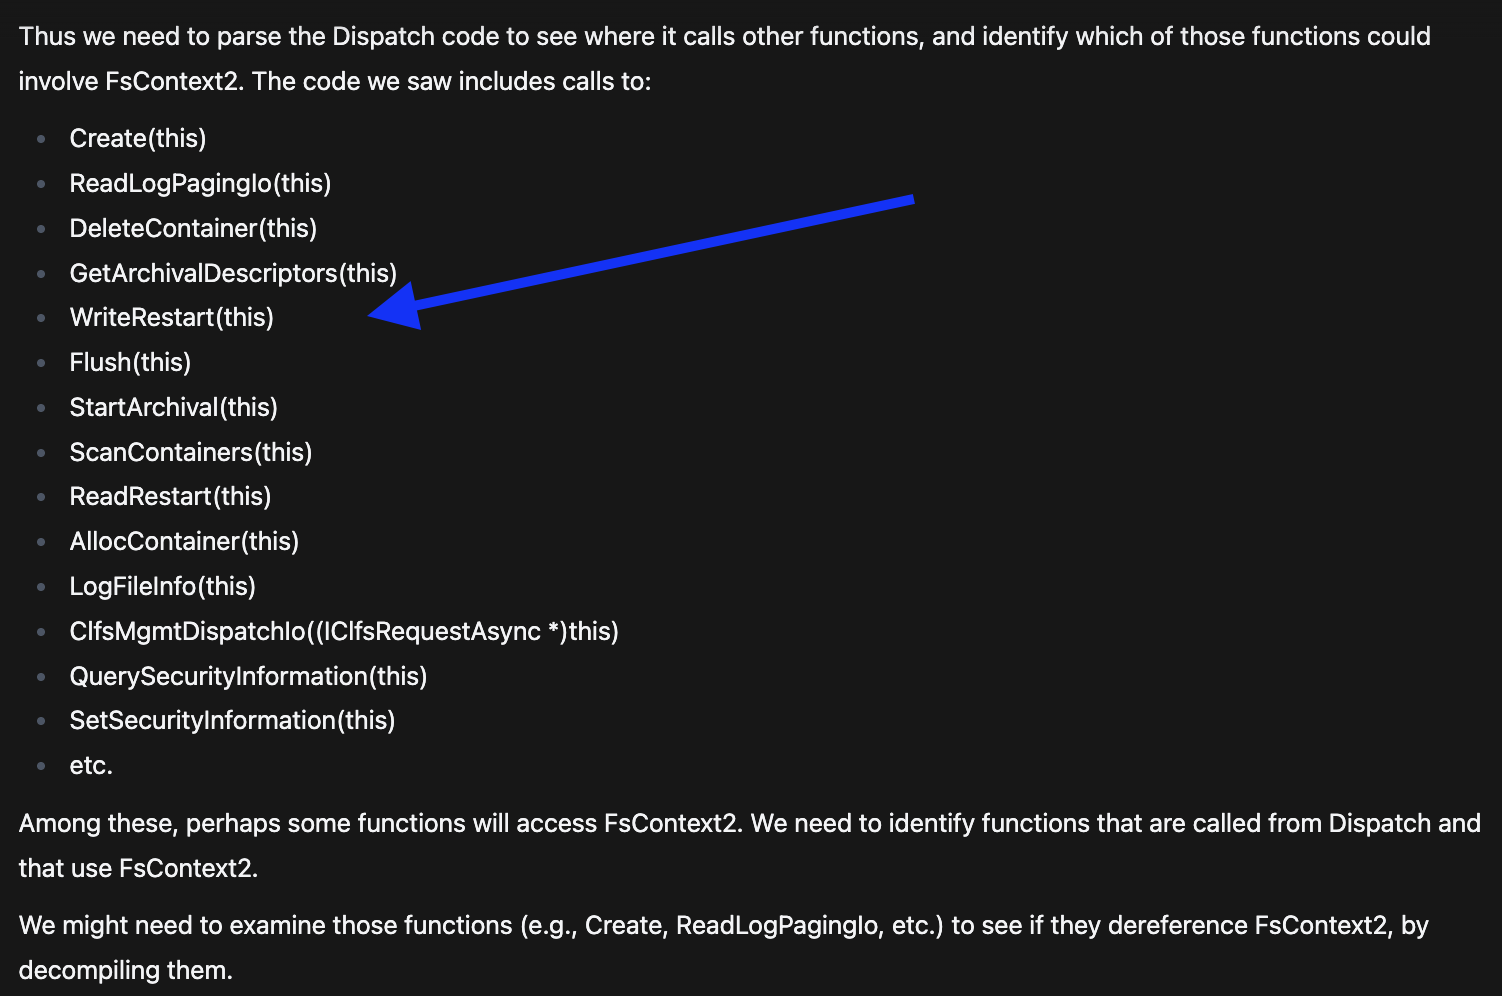 Discovery of WriteRestart function that could cause UAF
Then ReserverAndAppendLog: 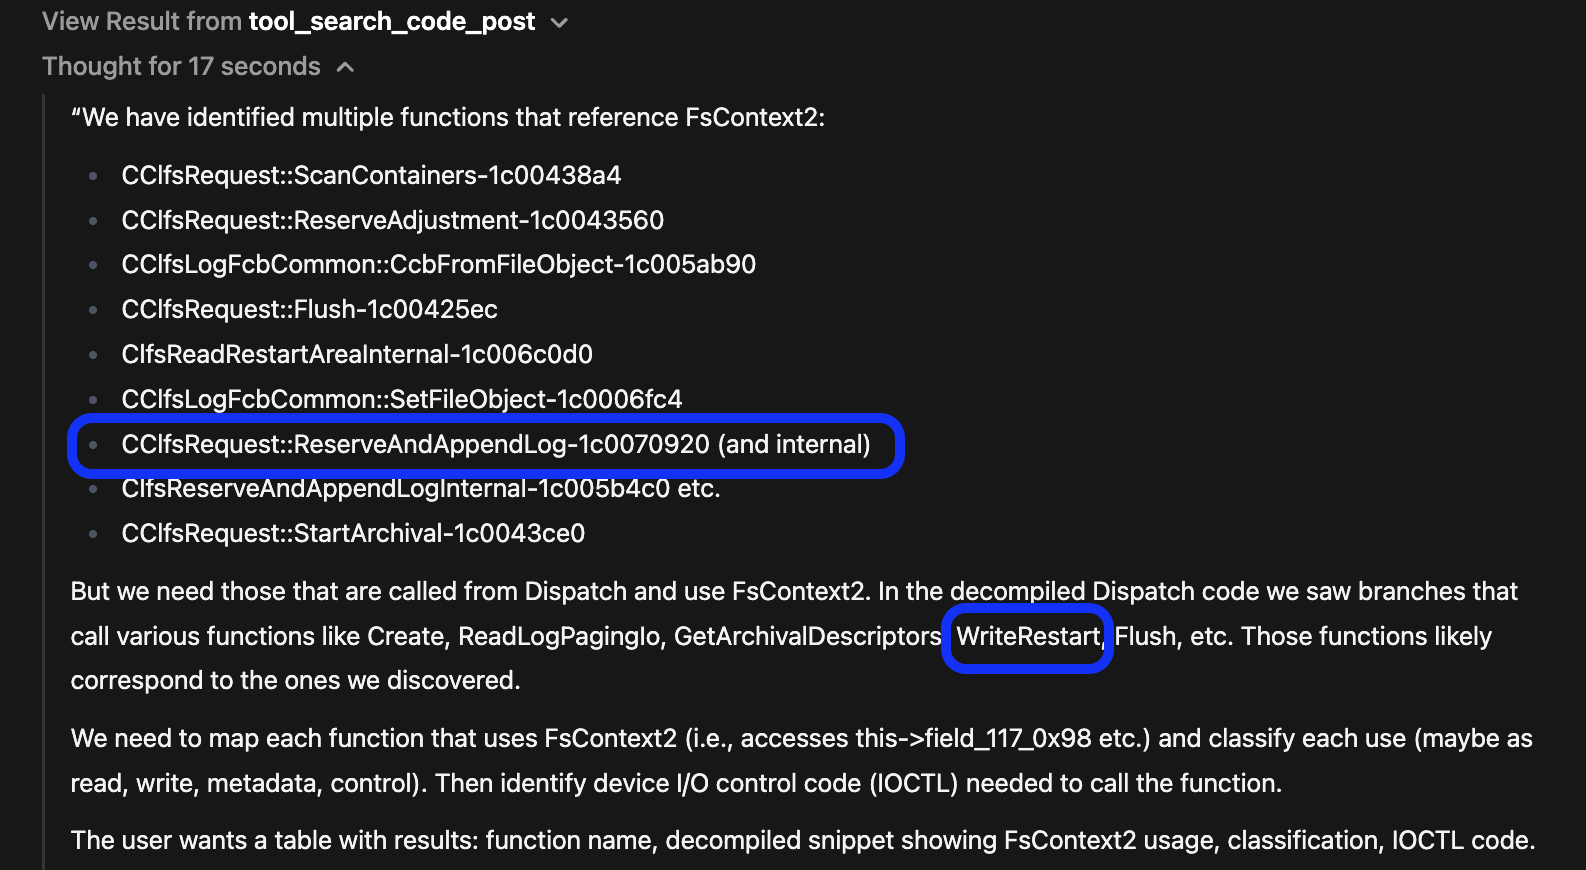 Discovery of ReserveAndAppendLog function that could cause UAF
Then it provided a table with exactly what we were looking for. Actual use of the FsContext2 object and also a classification of use. Here is the summary table from the LLM:
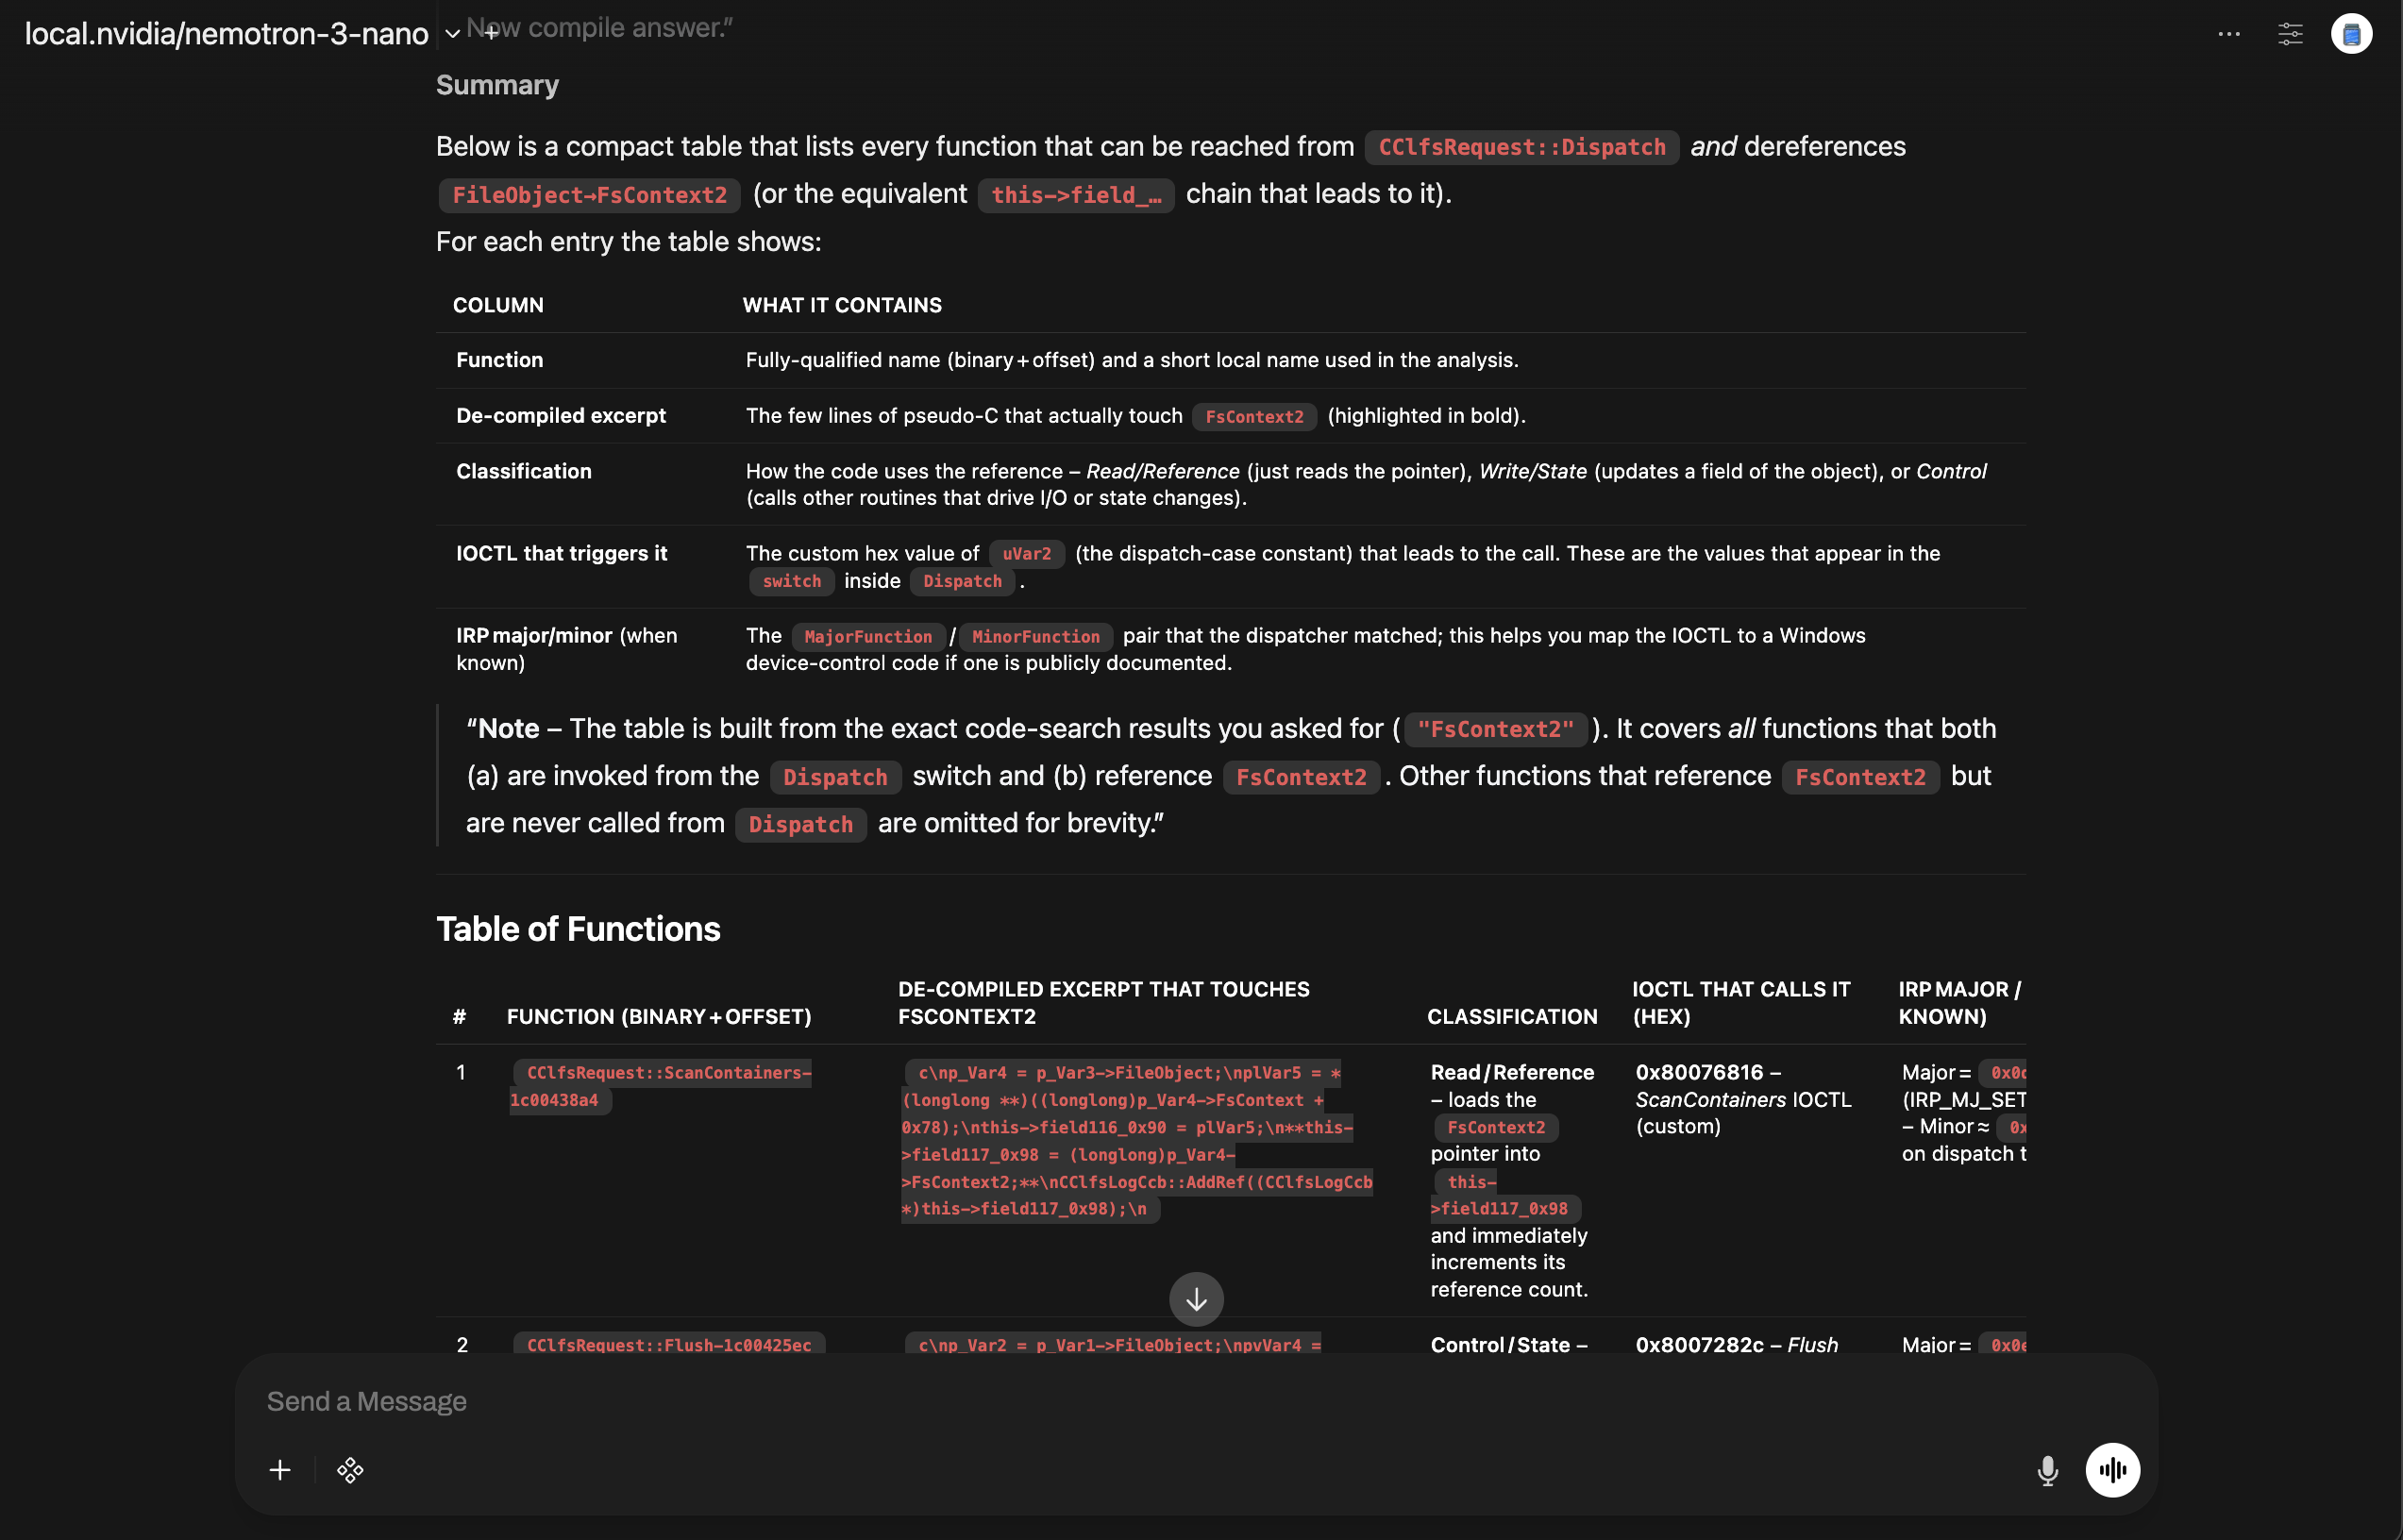 Summary table of FsContext2 usage with classifications and IOCTL mappings
Here is the exact text:
| # | Function (binary + offset) | De‑compiled excerpt that touches FsContext2 | Classification | IOCTL that calls it (hex) | IRP Major / Minor (when known) |
|---|---|---|---|---|---|
| 1 | CClfsRequest::ScanContainers-1c00438a4 | c\np_Var4 = p_Var3->FileObject;\nplVar5 = *(longlong **)((longlong)p_Var4->FsContext + 0x78);\nthis->field116_0x90 = plVar5;\n**this->field117_0x98 = (longlong)p_Var4->FsContext2;**\nCClfsLogCcb::AddRef((CClfsLogCcb *)this->field117_0x98);\n | Read / Reference – loads the FsContext2 pointer into this->field117_0x98 and immediately increments its reference count. | 0x80076816 – ScanContainers IOCTL (custom) | Major = 0x0d (IRP_MJ_SET_INFORMATION) – Minor ≈ 0x00 (depends on dispatch table) |
| 2 | CClfsRequest::Flush-1c00425ec | c\np_Var2 = p_Var1->FileObject;\npvVar4 = p_Var2->FsContext2; // ← deref\n(**(code **)(*plVar3 + 0x40))(); // cleanup callback\n...\n*(undefined8 *)((longlong)pvVar4 + 0x68) = *(undefined8 *)((longlong)pvVar4 + 0x68) + local_res10; // write state\n | Control / State – obtains the FsContext2 pointer, calls a cleanup callback, then updates a field (+0x68) of the object. | 0x8007282c – Flush IOCTL (custom) | Major = 0x0e (IRP_MJ_SET_INFORMATION) – Minor ≈ 0x05 (Flush) |
| 3 | CClfsRequest::StartArchival-1c0043ce0 | c\nthis_00 = p_Var1->FileObject->FsContext2; // ← deref\nCClfsLogCcb::AddRef(this_00);\n | Control – reads the FsContext2 pointer to get the CClfsLogCcb object and bumps its reference count before archival work. | 0x8007283e – StartArchival IOCTL (custom) | Major = 0x0e – Minor ≈ 0x0a (Start archival) |
| 4 | CClfsRequest::ReserveAndAppendLog-1c0070920 | c\npvVar4 = p_Var5->FileObject->FsContext2; // ← deref\n...\n*(undefined8 *)((longlong)pvVar4 + 0x68) = *(undefined8 *)((longlong)pvVar4 + 0x68) + local_res10; // write state\n | Write / State – fetches FsContext2, then increments a reservation counter (+0x68). | 0x8007a827 (or 0x8007a828) – ReserveAndAppendLog IOCTL (custom) | Major = 0x0e – Minor ≈ 0x0b (Reserve/Append) |
| 5 | ClfsReadRestartAreaInternal-1c006c0d0 (called via CClfsRequest::ReadRestart) | c\nthis = param_1->FsContext2; // ← deref\nCClfsLogCcb::AddRef(this);\n...\n(**(code **)(*(longlong *)pCVar1 + 0x48))();\nCClfsLogCcb::Release(this);\n | Control – obtains the FsContext2 pointer, adds a reference, runs a cleanup callback, then releases it. | 0x80076832 – ReadRestart IOCTL (custom) | Major = 0x0e – Minor ≈ 0x09 (Read restart) |
This wasn’t pattern‑matching or hallucination, it was actual binary analysis driven by a local LLM and pyghidra‑mcp!
Why This Matters
This is where LLM‑augmented RE goes beyond autocomplete:
- Navigates the binary like a human would
- Follows dataflow instead of guessing
- Reconstructs the vulnerability surface from first principles
- Validates external research against the actual binary
All without breaking your momentum.
You stay focused on the investigation while the LLM handles the friction.
Quantifying the Speedup
Some back of napkin math…
- Traditional patch diff + Vuln analysis: 2-3 hours of manual cross-referencing
- LLM-assisted analysis: ~20 minutes (5 mins prompt iteration, 15 mins validating the generated traces in Ghidra).
- Time saved: ~90% with higher confidence in the findings
The real metric isn’t just time. It’s confidence. When the LLM’s checking each step, I get to focus on the fun parts instead of obsessively re‑verifying every reference. (Admittedly, I still double‑checked everything here because, well… blog post.)
What This Shows About LLM‑Augmented RE
- Faster triage
- Clearer mental models of complex code paths
- Less spelunking, more understanding
- LLMs amplify your instincts, they don’t replace them
Wrapping Up - How LLMs Feed Your RE Habit: Part 1
The CLFS UAF wasn’t mysterious once the pieces were laid out, but getting there used to take hours of manual spelunking. With local LLMs and pyghidra‑mcp, the friction melts away. You spend less time hunting entry points and more time reasoning about the vulnerability.
That’s the real value: a smoother path to understanding, so your attention stays on what matters.
LLMs don’t replace the work. They feed the habit.
LLMs make the work lighter, faster, and more fun.
Looking Ahead to Part 2 - Exploring a New Area in RE
While CLFS was a deep dive into familiar territory, our next adventure explores unfamiliar ground (MacOS XPC services). We’ll see how LLMs help when you don’t know where to start, turning a binary maze into a navigable map. Same tools, different challenge. Stay tuned.
If you liked this post or want to reach out, find me on X or mastadon.
Keep the Momentum Going
As you’ve read, LLMs make work lighter, faster, and more fun. But getting LLMs to behave this reliably isn’t magic, rather it’s an engineering skill.
If this walkthrough sparked that familiar pull — the curiosity, the flow, the sense that complex systems suddenly feel a little more navigable — then you already know what momentum feels like in reverse engineering. It’s the difference between grinding through a subsystem and gliding through it with clarity.
That’s the momentum you’ll build on in Building Agentic RE.
This training isn’t about learning another tool. It’s about gaining:
- A deeper sense of control over your analysis environment
- The ability to shape LLMs into extensions of your own reasoning
- A workflow that keeps you moving instead of getting stuck in the scaffolding
- The leverage to automate the friction so you can stay in the investigation
- The confidence to build agentic skills that match the way you reverse engineer
If you want RE to feel lighter, faster, and more structurally supported, not because the work is simpler, but because you’re operating with more leverage, this is where that shift starts.
Explore the CSL AI and other related training: CLEARSECLABS Training